Retail Space
9674 Colerain Avenue Cincinnati, OH 45251
9674 Colerain Avenue Cincinnati, OH 45251

Details & Description
Property Highlights
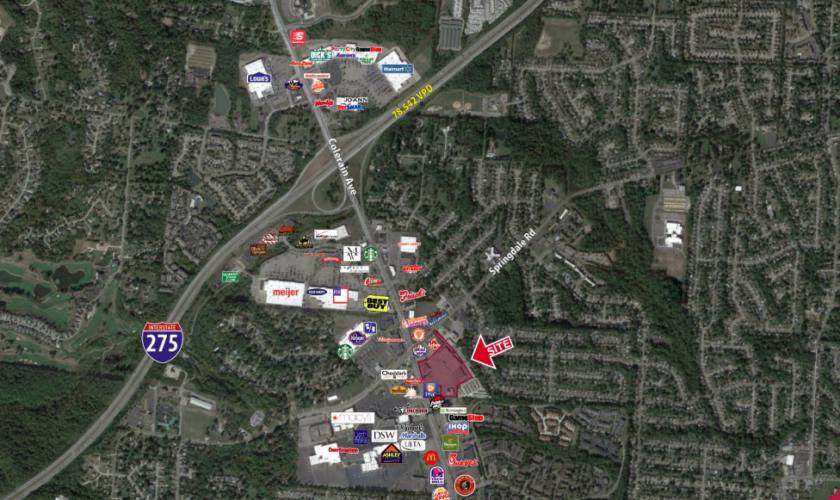
• Directly across from Northgate Mall at the major corner of Colerain & Springdale Roads
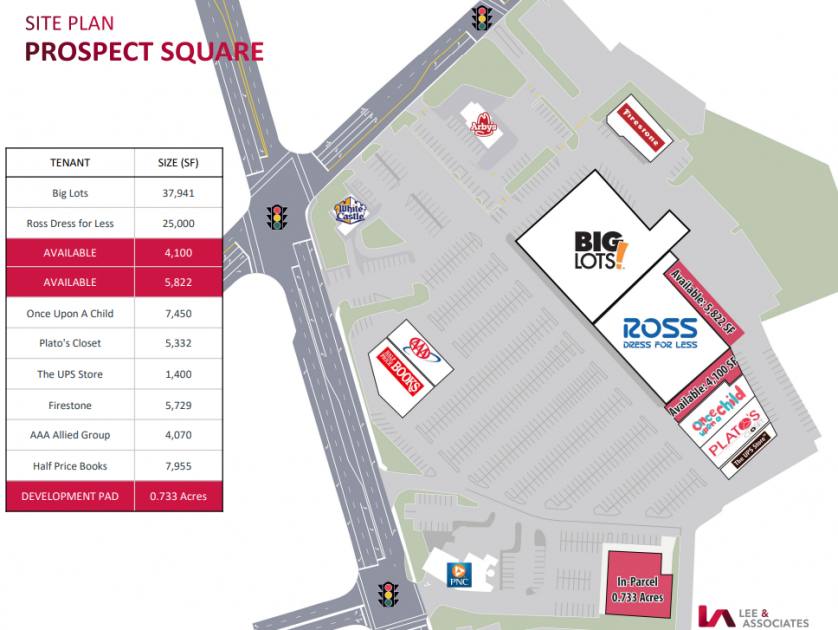
• Huge pylon signs on both Colerain Avenue and Springdale Roads
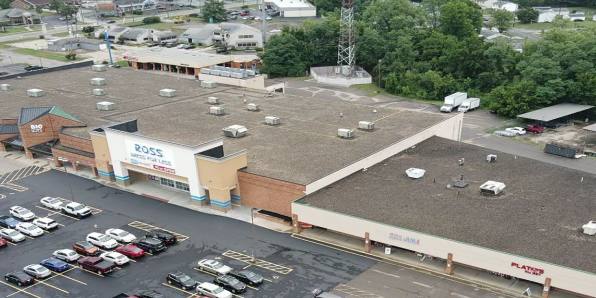
Additional Photos


Listing Agents

John Thompson
O: 513-588-1842
M: 513-703-2500
jthompson@lee-associates.com
O: 513-588-1842
M: 513-703-2500
jthompson@lee-associates.com

Chris Nachtrab
O: 513-588-1841
M: 513-604-1899
cnachtrab@lee-associates.com
O: 513-588-1841
M: 513-604-1899
cnachtrab@lee-associates.com

TC Bartoszek
O: 513-588-1840
M: 513-535-0563
tcbartoszek@lee-associates.com
O: 513-588-1840
M: 513-535-0563
tcbartoszek@lee-associates.com
While we strive to provide the most accurate information, all listing information, and demographic data, is provided by third-parties. As such, MyEListing will not be responsible for the accuracy of the information. It is strongly recommended that you verify all information with the listing agent, and any relevant agencies, prior to making any decisions.