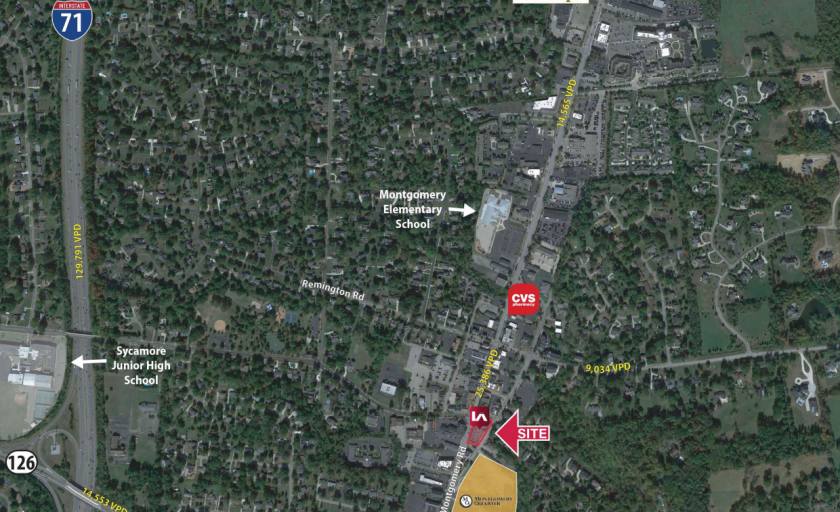
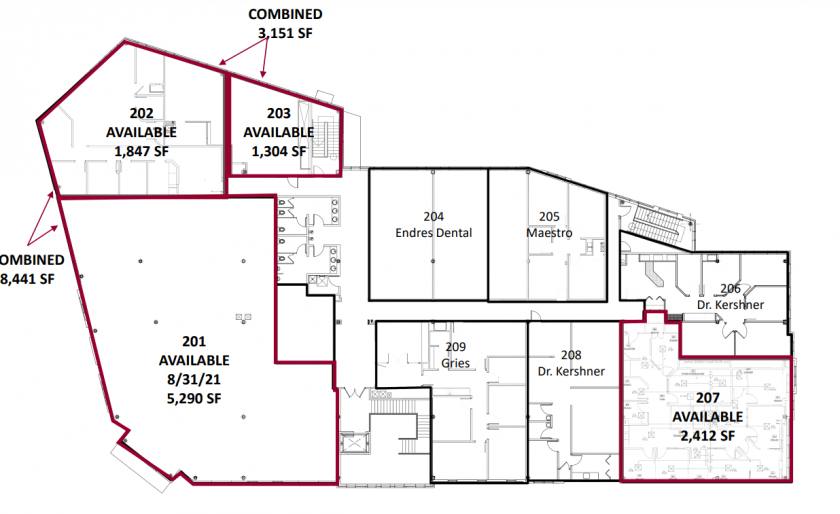
Retail Space
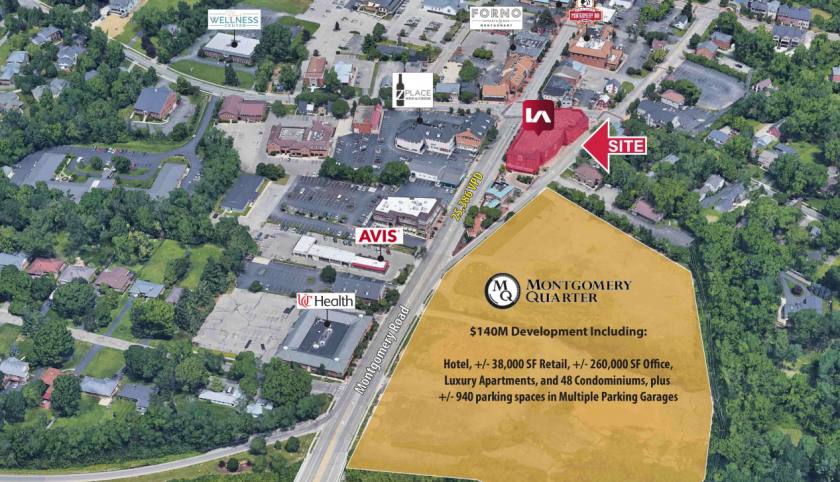
9366 Montgomery Road Cincinnati, OH 45242
9366 Montgomery Road Cincinnati, OH 45242
Details & Description
Property Highlights
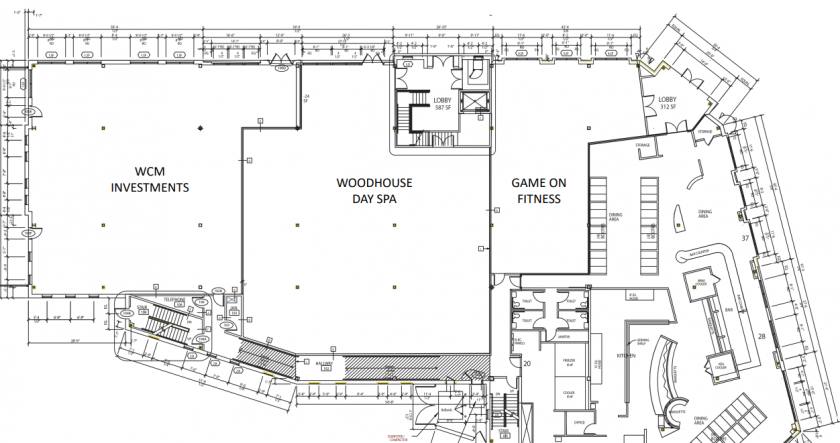
- • Napa Kitchen & Bar on 1st floor
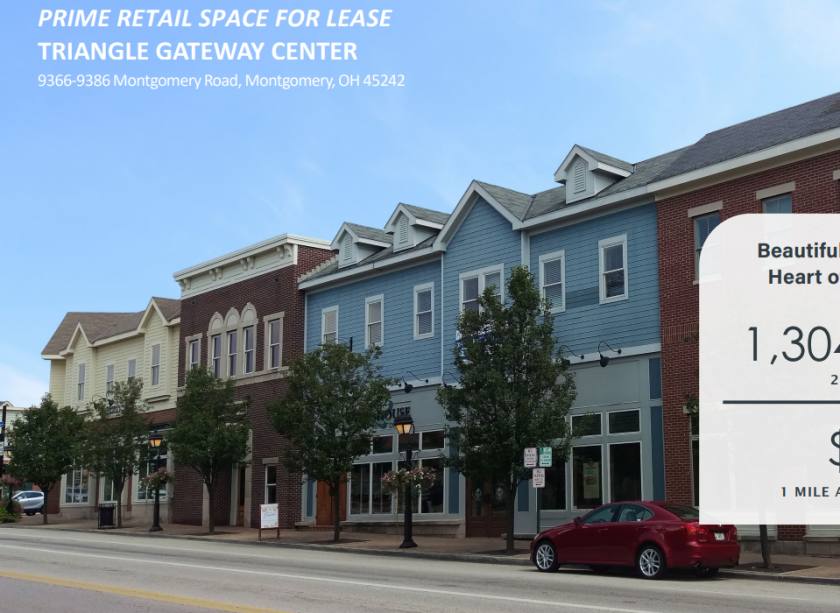
- • High-end finishes throughout the building
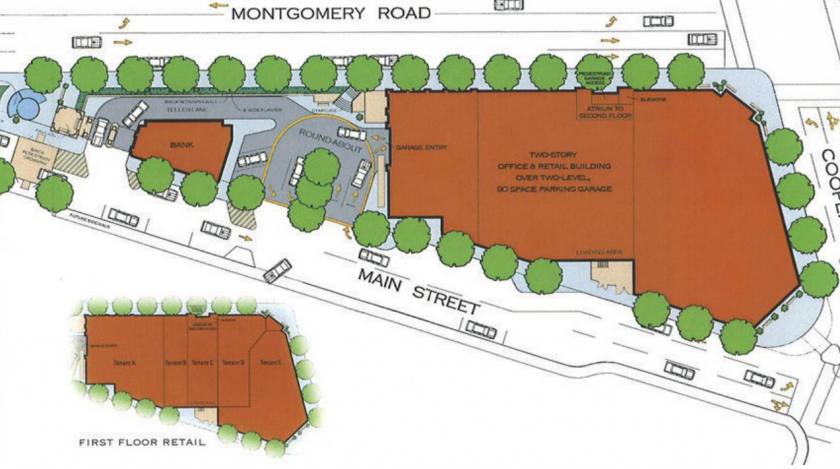
- • Parking garage with 90 spaces
Additional Photos
Listing Agents

Chris Nachtrab
O: 513-588-1841
M: 513-604-1899
cnachtrab@lee-associates.com
O: 513-588-1841
M: 513-604-1899
cnachtrab@lee-associates.com
While we strive to provide the most accurate information, all listing information, and demographic data, is provided by third-parties. As such, MyEListing will not be responsible for the accuracy of the information. It is strongly recommended that you verify all information with the listing agent, and any relevant agencies, prior to making any decisions.