Retail Space
5003 Cornell Road Blue Ash, OH 45242
5003 Cornell Road Blue Ash, OH 45242

Details & Description
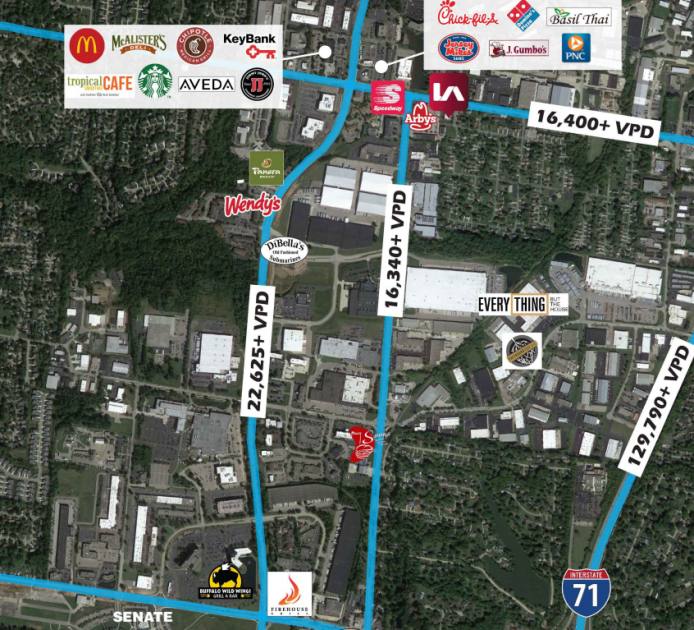
Property Highlights
• Area retailers and restaurants include Skyline Chili, Chic-FilA, Arby’s, Chipotle, Starbucks, Jimmy John’s,
• Other retailers & restaurants: The Joint Chiropractic, Key Bank, Panera and McAlister's Deli, and McDonald&rsq
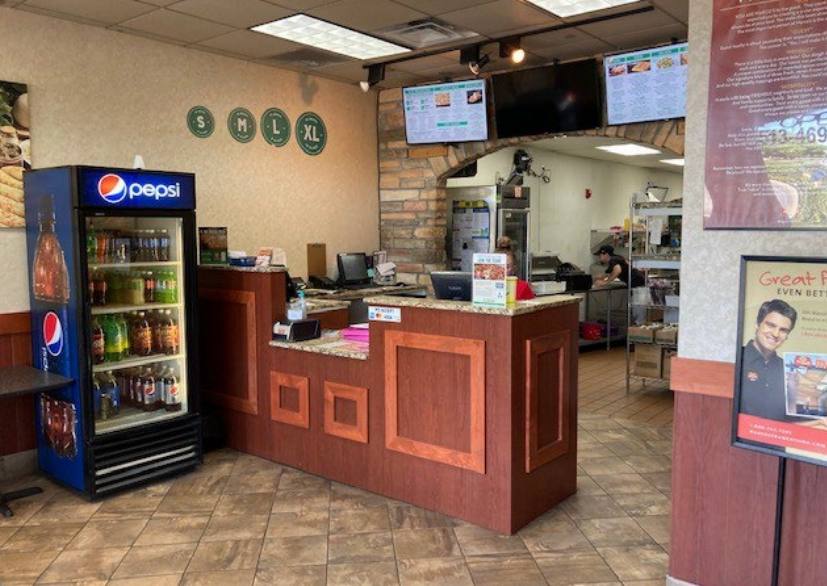
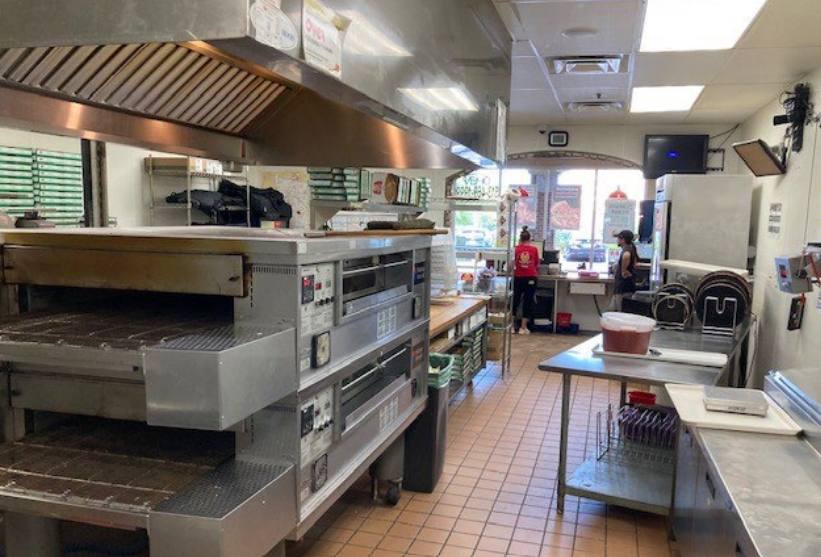
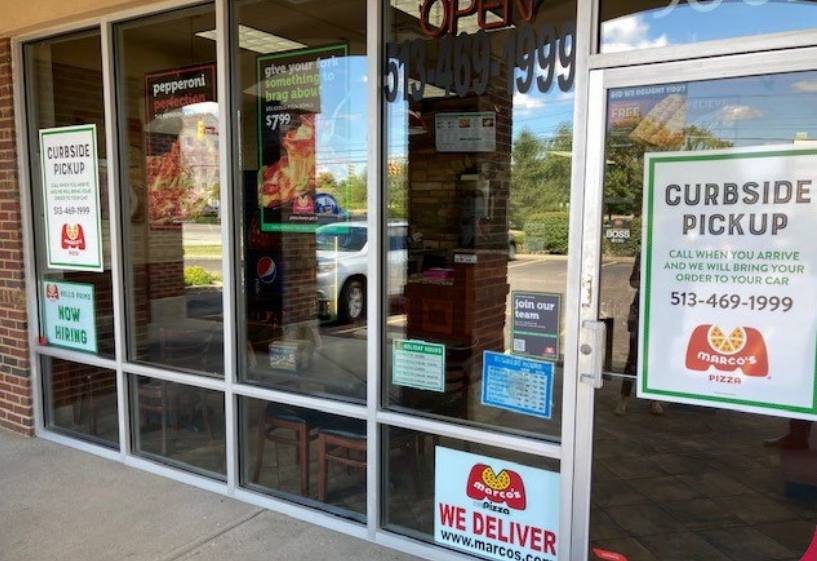
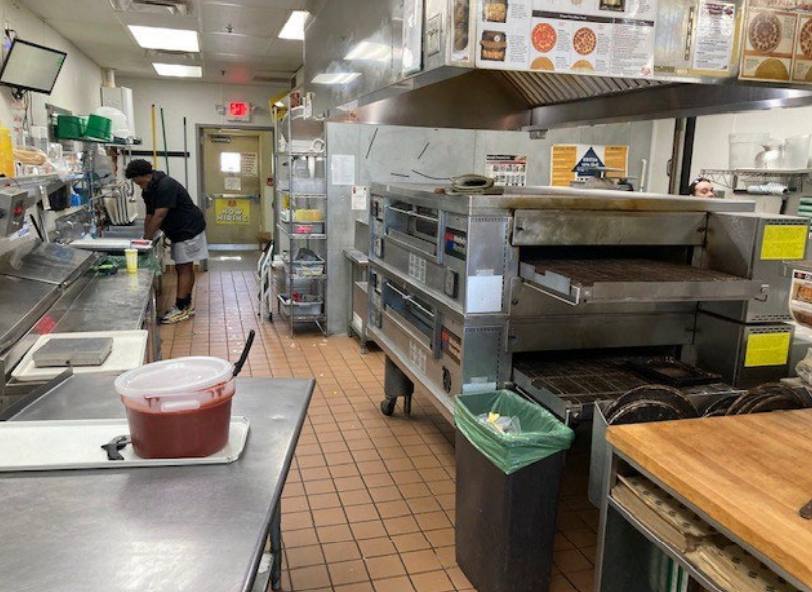
Additional Photos
Listing Agents

John Thompson
O: 513-588-1842
M: 513-703-2500
jthompson@lee-associates.com
O: 513-588-1842
M: 513-703-2500
jthompson@lee-associates.com
While we strive to provide the most accurate information, all listing information, and demographic data, is provided by third-parties. As such, MyEListing will not be responsible for the accuracy of the information. It is strongly recommended that you verify all information with the listing agent, and any relevant agencies, prior to making any decisions.