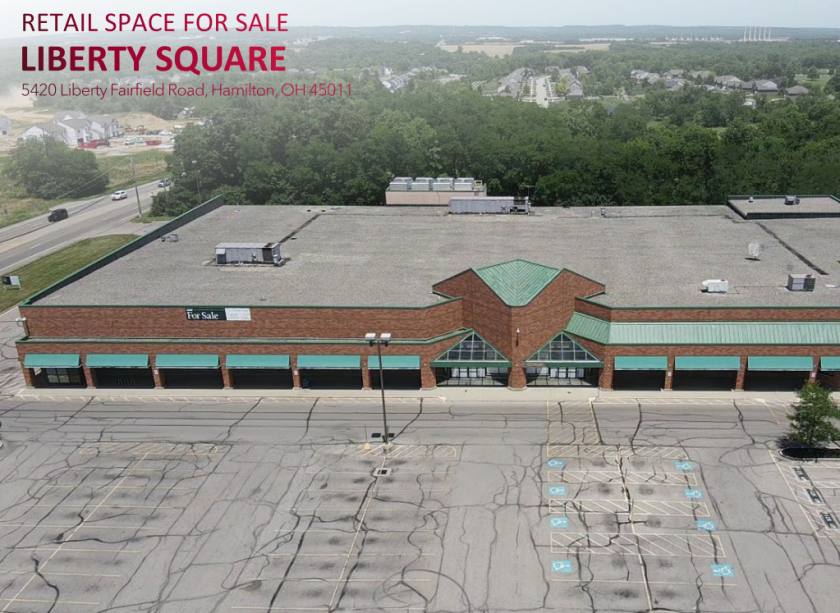
Retail Space
5420 Liberty Fairfield Road Hamilton, OH 45013
5420 Liberty Fairfield Road Hamilton, OH 45013
Details & Description
Property Highlights
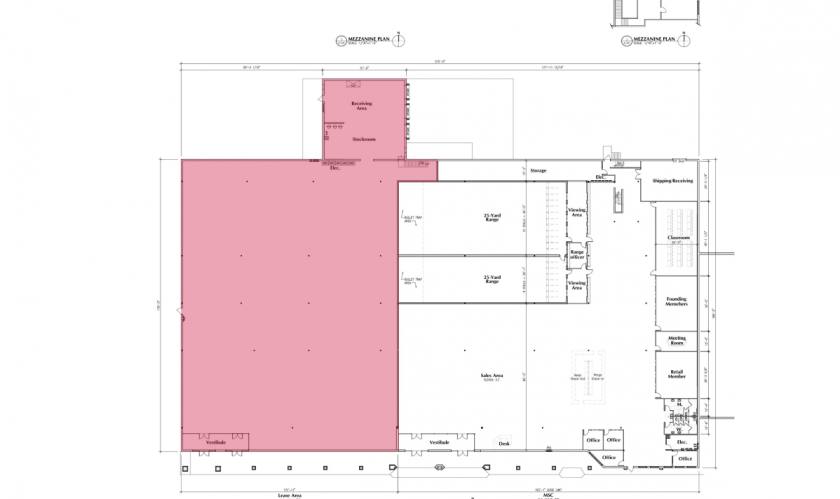
- • Endcap retail space available
- • 3 dock door access (dock height 10')
- • Large Parking Lot (408 spaces)
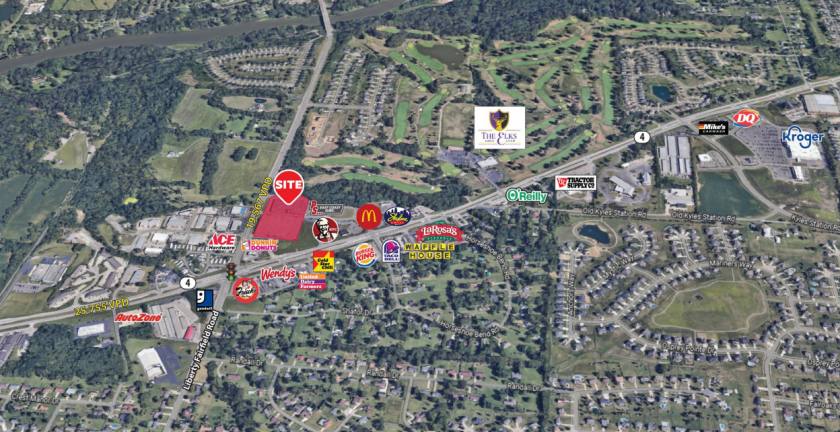
- • Proximity to I-75 and Butler County Highway
- • Large Space on Pylon Sign Available
Listing Agents

TC Bartoszek
O: 513-588-1840
M: 513-535-0563
tcbartoszek@lee-associates.com
O: 513-588-1840
M: 513-535-0563
tcbartoszek@lee-associates.com

Molly Hoffman
O: 513-588-1843
mhoffman@lee-associates.com
O: 513-588-1843
mhoffman@lee-associates.com
While we strive to provide the most accurate information, all listing information, and demographic data, is provided by third-parties. As such, MyEListing will not be responsible for the accuracy of the information. It is strongly recommended that you verify all information with the listing agent, and any relevant agencies, prior to making any decisions.