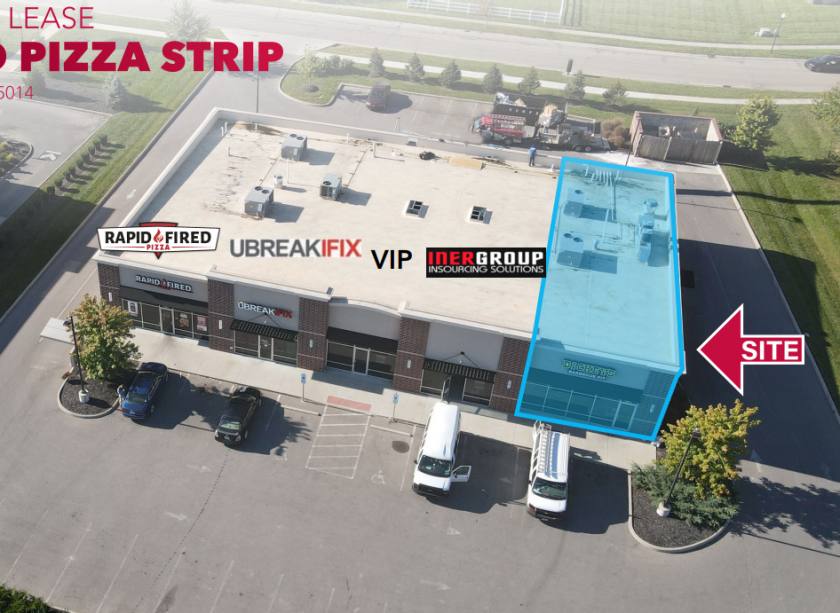
1-Mile | 3-Miles | 5-Miles | ||
---|---|---|---|---|
Total Population | 5,301 | 53,783 | 146,828 | |
Population Median Age | 37 | 37 | 39 | |
Population by Age | 0-9 Yrs | 695 (13%) | 7585 (14%) | 19912 (13%) |
10-19 Yrs | 563 (10%) | 7200 (13%) | 19074 (12%) | |
20-29 Yrs | 932 (17%) | 8018 (14%) | 19416 (13%) | |
30-39 Yrs | 881 (16%) | 7306 (13%) | 18745 (12%) | |
40-49 Yrs | 696 (13%) | 6565 (12%) | 17677 (12%) | |
50-59 Yrs | 444 (8%) | 5845 (10%) | 18844 (12%) | |
60-69 Yrs | 640 (12%) | 5926 (11%) | 17539 (11%) | |
70+ Yrs | 450 (8%) | 5338 (9%) | 15622 (10%) | |
Median HH Income | $56,258 | $59,836 | $66,190 | |
Total Household Income | < 24K | 422 (17%) | 3684 (17%) | 9036 (15%) |
25-49K | 640 (27%) | 5247 (24%) | 12229 (21%) | |
50-74K | 540 (22%) | 4437 (21%) | 11708 (20%) | |
75-99K | 319 (13%) | 2711 (12%) | 7700 (13%) | |
100-199K | 434 (18%) | 4204 (19%) | 12929 (22%) | |
200K+ | 15 (0%) | 784 (3%) | 3845 (6%) | |
Highest Education Level | No Diploma | 321 | 3397 | 7534 |
Diploma or GED | 1286 | 11347 | 29528 | |
Some College | 710 | 7261 | 19415 | |
Assoc. Degree | 276 | 2690 | 8407 | |
Bachelors Degree | 773 | 7316 | 22304 | |
Higher Degree | 277 | 3415 | 11489 | |
Total Housing Units | 2,637 | 22,300 | 60,962 | |
--Owner-Occupied | 1,019 | 11,087 | 36,632 | |
--Renter-Occupied | 1,350 | 9,981 | 20,814 | |
Owner-Occupied Values | < 100K | 371 | 2582 | 7222 |
100-199K | 497 | 6289 | 17307 | |
200-299K | 135 | 1858 | 7639 | |
300-399K | 11 | 292 | 2518 | |
400-499K | 0 | 2 | 999 | |
500K+ | 5 | 65 | 948 | |
Total Working Age Population | 4,263 | 41,740 | 114,987 | |
In Work Force | 2,952 | 28,316 | 77,586 | |
Not In Work Force | 1,311 | 13,424 | 37,401 | |
Workforce Employed | 2,697 | 26,576 | 73,595 | |
Workforce Unemployed | 244 | 1,718 | 3,890 | |
Civlian Workforce | 2,941 | 28,294 | 77,485 | |
Military Workforce | 11 | 22 | 101 | |
Total Households | 2,370 | 21,068 | 57,446 | |
Family Households | 1,201 | 12,917 | 37,461 | |
Non-Family Households | 1,169 | 8,150 | 19,985 | |
Married Couple | 805 | 8,081 | 26,210 | |
Other Family | 396 | 4,837 | 11,252 | |
Married w/Child | 413 | 3,541 | 10,295 | |
Single Male w/Child | 18 | 416 | 1,181 | |
Single Female w/Child | 198 | 2,272 | 5,227 |
Population Change Last Two Decades - Plus Projection
2000 | % | 2010 | % | 2020 | % | 2030 | |
---|---|---|---|---|---|---|---|
Ohio | 11,353,140 | +2 | 11,536,504 | 0 | 11,574,870 | 0 | 11,615,100 |
Hamilton County | 845,303 | -5 | 802,374 | -1 | 790,600 | -1 | 785,900 |
Butler County | 332,807 | +11 | 368,130 | +6 | 390,110 | +5 | 410,960 |
Total Working Age Population:
Total Households:
Total Working Age Population:
Total Households:
Total Working Age Population:
Total Households: