Commercial Land
5315 Beechmont Avenue Cincinnati, OH 45230
5315 Beechmont Avenue Cincinnati, OH 45230
Details & Description
Property Highlights
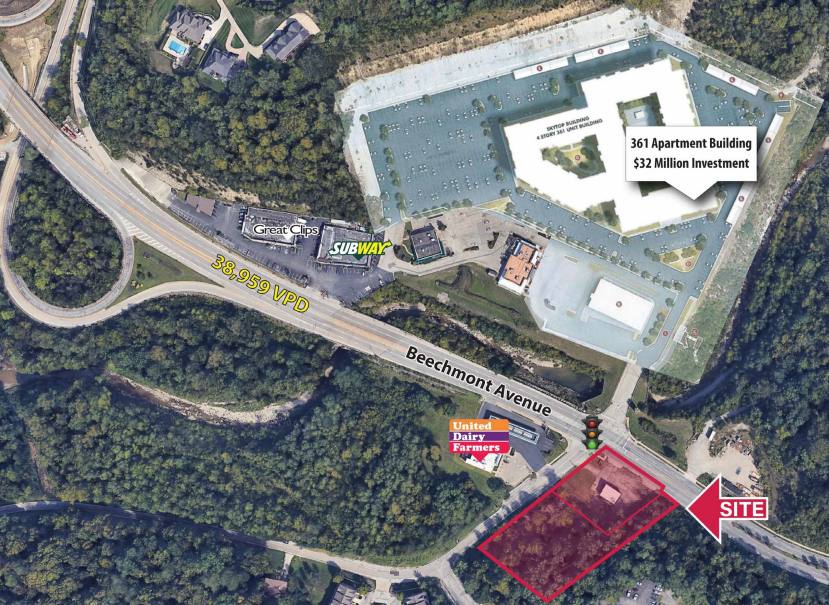
- • 2 parcels totaling 1.918 acres
- • Zoned Business District E
- • 38,959 VPD on Beechmont Avenue
Listing Agents

Gary Fisher
O: 513-588-1125
M: 513-658-3411
gfisher@lee-associates.com
O: 513-588-1125
M: 513-658-3411
gfisher@lee-associates.com
While we strive to provide the most accurate information, all listing information, and demographic data, is provided by third-parties. As such, MyEListing will not be responsible for the accuracy of the information. It is strongly recommended that you verify all information with the listing agent, and any relevant agencies, prior to making any decisions.


