Retail Space
10738 Kenwood Road Cincinnati, OH 45242
10738 Kenwood Road Cincinnati, OH 45242

Details & Description
Property Highlights
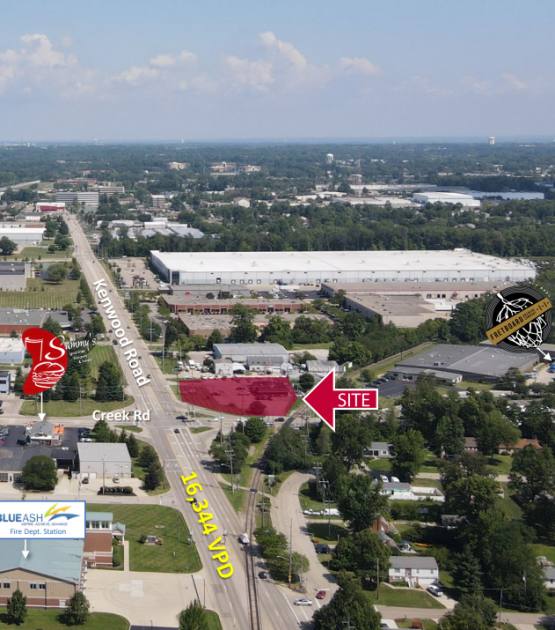
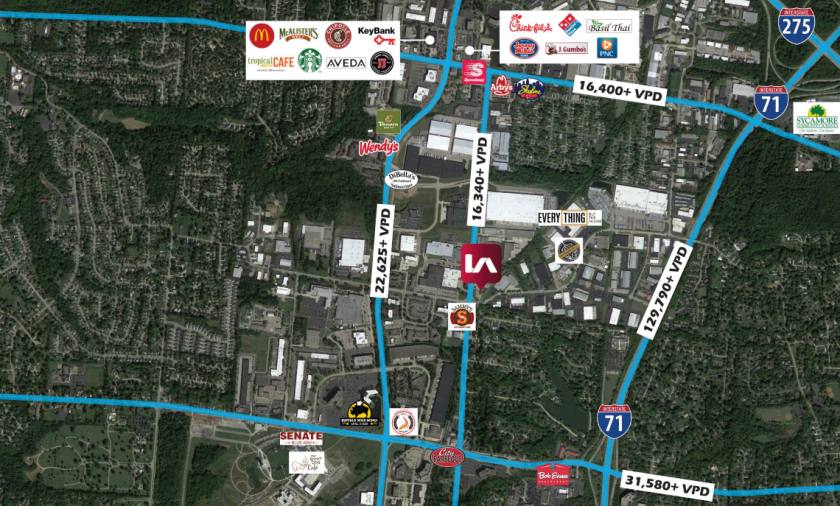
- • Rare Blue Ash Location
- • Traffic Light Corner
- • Extreme High Daytime Traffic
- • Near Major Highways
- • High Visibility - Prime Corner - Two Entrances
- • 1+ Acre available for Sale
Listing Agents

TC Bartoszek
O: 513-588-1840
M: 513-535-0563
tcbartoszek@lee-associates.com
O: 513-588-1840
M: 513-535-0563
tcbartoszek@lee-associates.com

Molly Hoffman
O: 513-588-1843
mhoffman@lee-associates.com
O: 513-588-1843
mhoffman@lee-associates.com
While we strive to provide the most accurate information, all listing information, and demographic data, is provided by third-parties. As such, MyEListing will not be responsible for the accuracy of the information. It is strongly recommended that you verify all information with the listing agent, and any relevant agencies, prior to making any decisions.