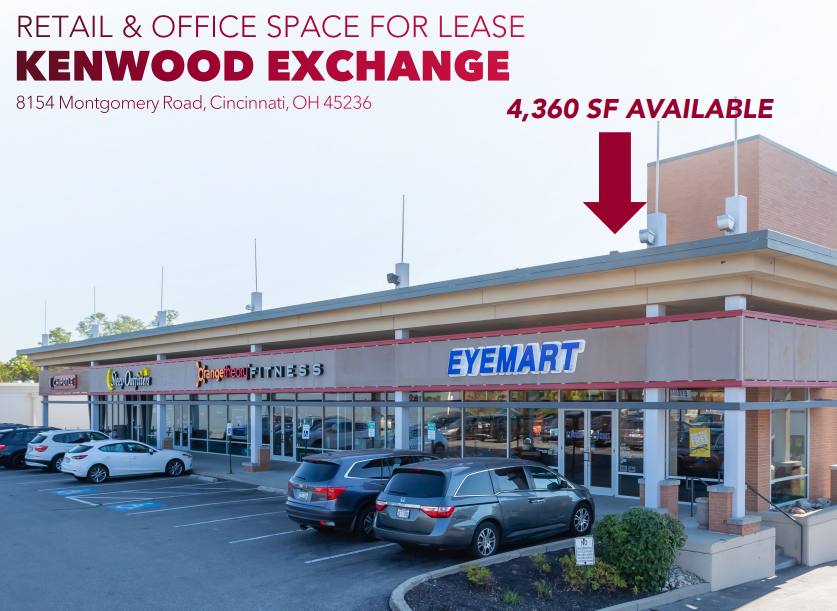
Office Space
8154 Montgomery Road Cincinnati, OH 45236
8154 Montgomery Road Cincinnati, OH 45236
Details & Description
Property Highlights
• Highly visible location in Cincinnati’s premier retail trade area within close proximity to Kenwood Towne Center
• Solid demographics in nearby Madeira, Indian Hill, Montgomery, and Kenwood neighborhoods
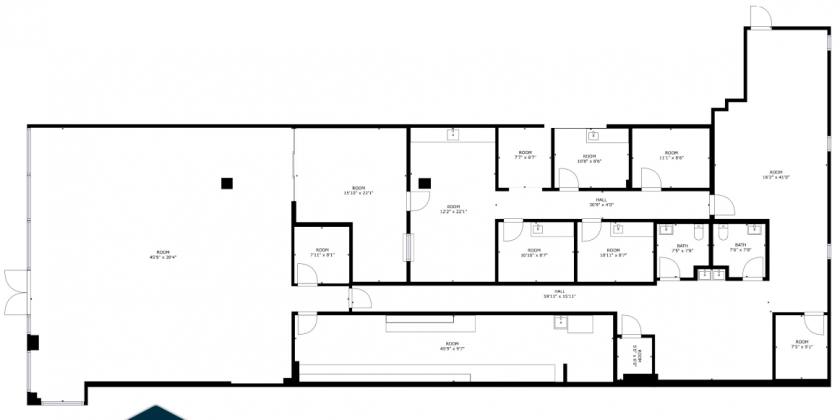
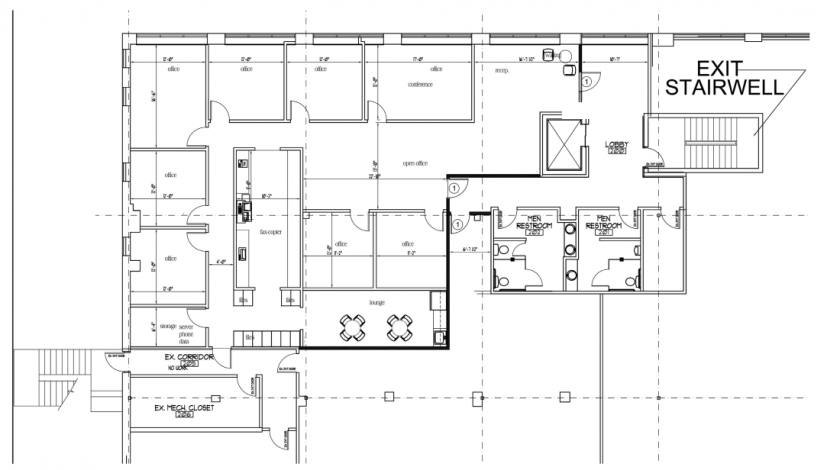
Additional Photos


Listing Agents

Dan McDonald
O: 513-588-1113
M: 513-608-2984
dan.mcdonald@lee-associates.com
O: 513-588-1113
M: 513-608-2984
dan.mcdonald@lee-associates.com

Stewart Devitt
O: 513-588-1115
stewart.devitt@lee-associates.com
O: 513-588-1115
stewart.devitt@lee-associates.com
While we strive to provide the most accurate information, all listing information, and demographic data, is provided by third-parties. As such, MyEListing will not be responsible for the accuracy of the information. It is strongly recommended that you verify all information with the listing agent, and any relevant agencies, prior to making any decisions.


