Office Space
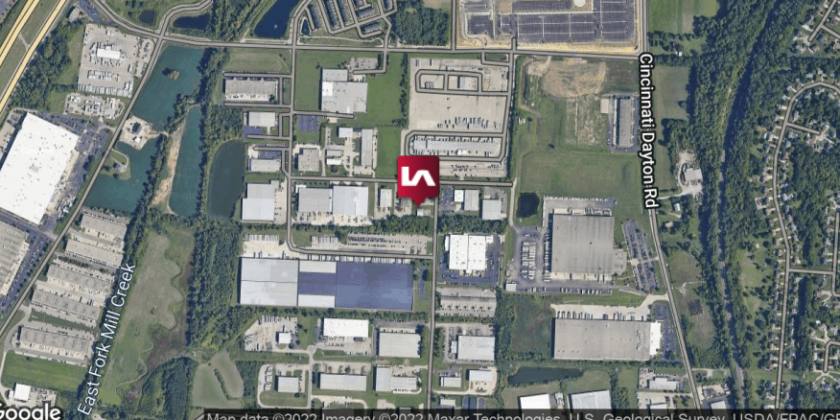
9753 Crescent Park Drive Fairfield, OH 45069
9753 Crescent Park Drive Fairfield, OH 45069
Details & Description
Property Highlights
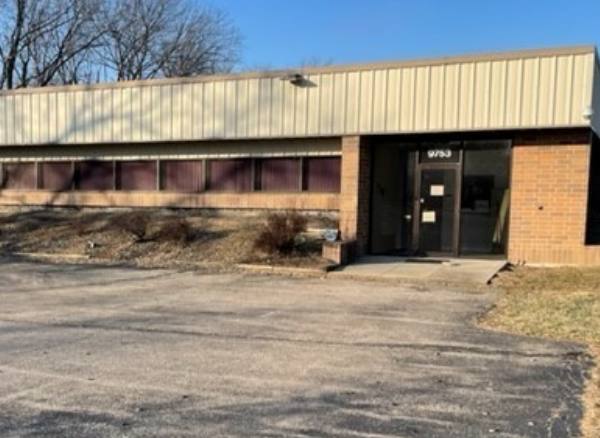
- • Office/Office Showroom
- • Single Story
- • Well Maintained
- • Parking for approx. 15
- • Central Alarm System
- • Zoned (2) HVAC
Listing Agents

Mark Freiberg
O: 513-588-1137
M: 513-886-3303
mfreiberg@lee-associates.com
O: 513-588-1137
M: 513-886-3303
mfreiberg@lee-associates.com
While we strive to provide the most accurate information, all listing information, and demographic data, is provided by third-parties. As such, MyEListing will not be responsible for the accuracy of the information. It is strongly recommended that you verify all information with the listing agent, and any relevant agencies, prior to making any decisions.