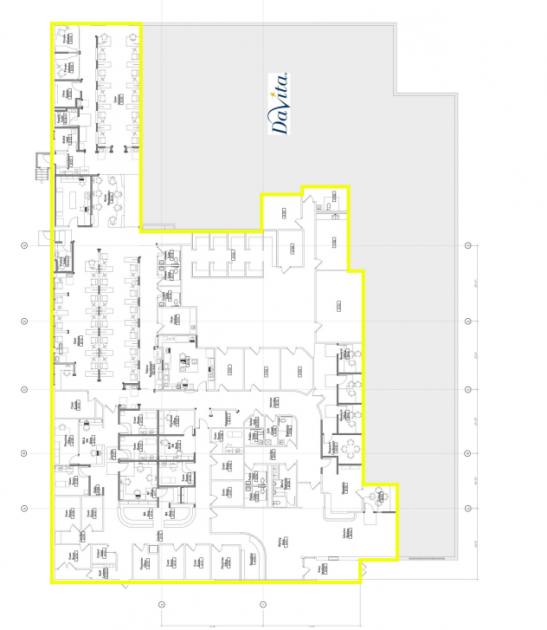
Office Space
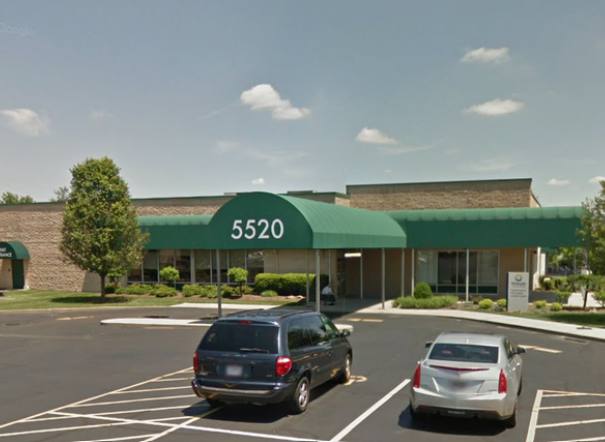
5520 Cheviot Road Cincinnati, OH 45247
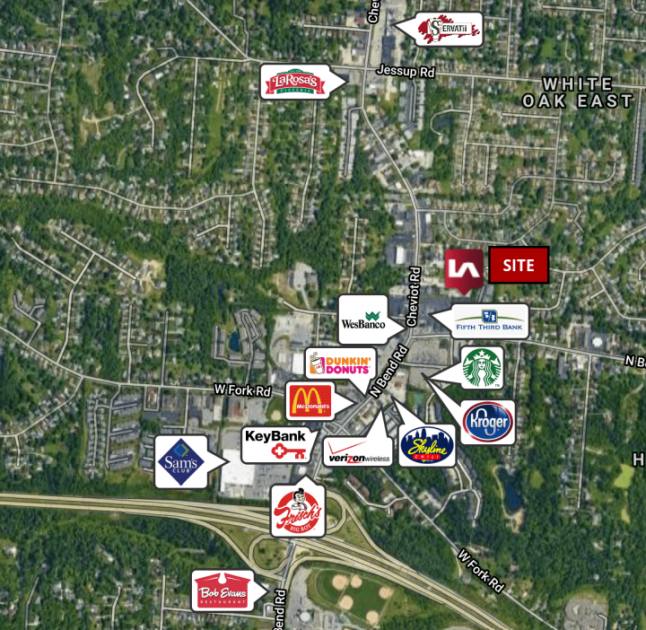
5520 Cheviot Road Cincinnati, OH 45247
Details & Description
Property Highlights
- • Extensive renovations and updates 2017
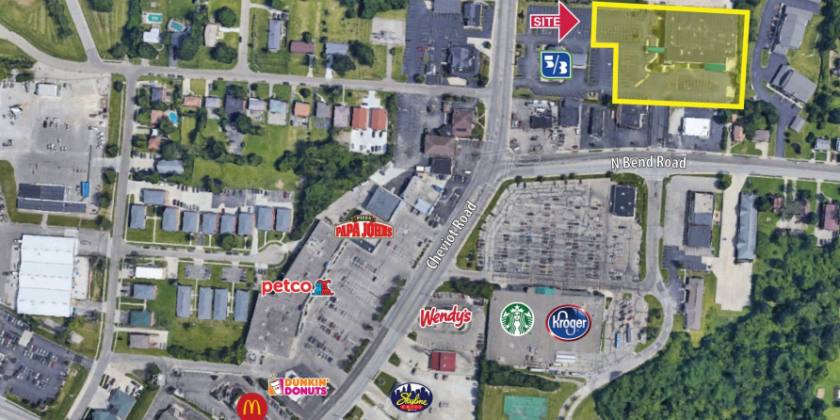
- • Corner of Cheviot and North Bend Roads
- • Green Township - No Earnings Tax!
- • Signalized Ingress/Egress
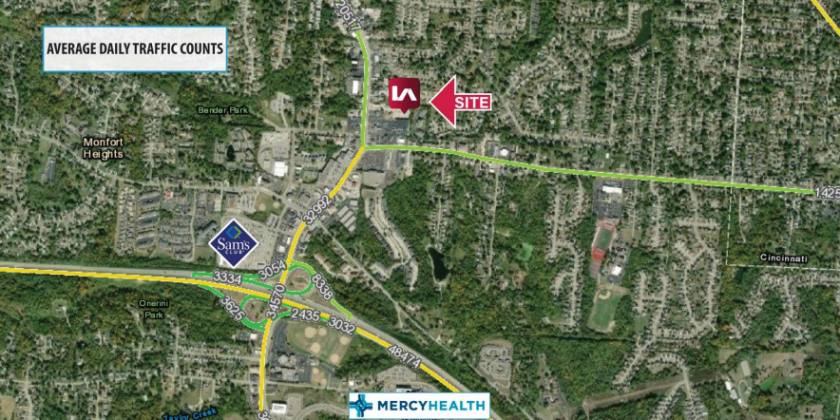
- • 32,992 ADT on Cheviot Road
- • 48,474 ADT on I-74
Additional Photos
Listing Agents

Gary Fisher
O: 513-588-1125
M: 513-658-3411
gfisher@lee-associates.com
O: 513-588-1125
M: 513-658-3411
gfisher@lee-associates.com

Mark Freiberg
O: 513-588-1137
M: 513-886-3303
mfreiberg@lee-associates.com
O: 513-588-1137
M: 513-886-3303
mfreiberg@lee-associates.com
While we strive to provide the most accurate information, all listing information, and demographic data, is provided by third-parties. As such, MyEListing will not be responsible for the accuracy of the information. It is strongly recommended that you verify all information with the listing agent, and any relevant agencies, prior to making any decisions.


