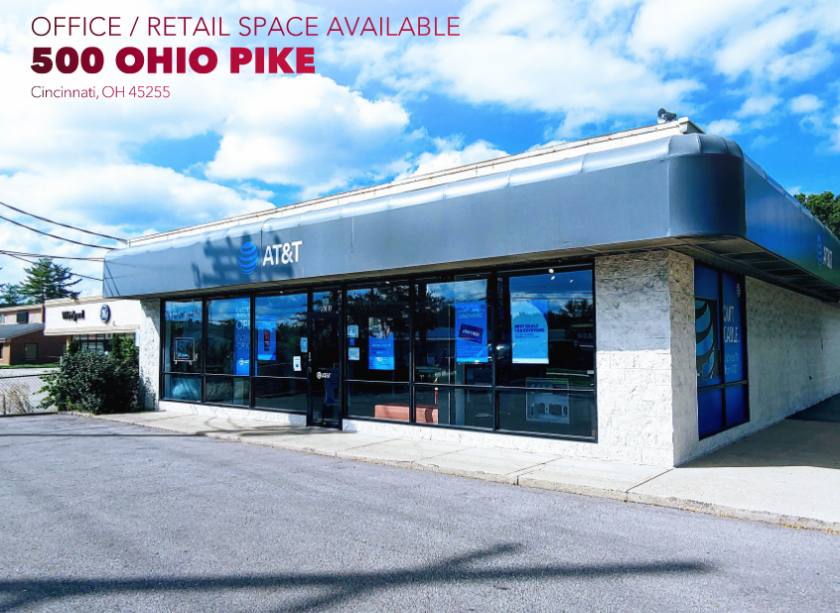
Office Space
500 Ohio Pike Cincinnati, OH 45255
500 Ohio Pike Cincinnati, OH 45255
Details & Description
Property Highlights
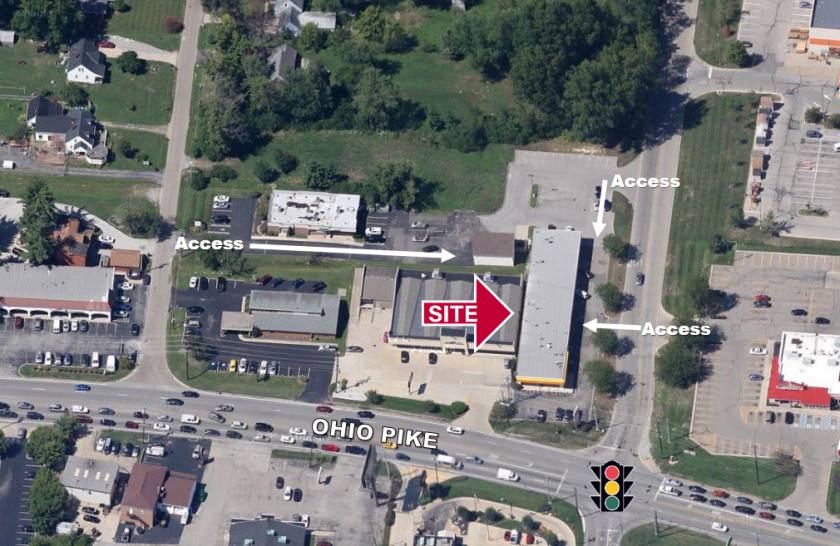
• Retail shopping center on busy Ohio Pike(State Route125)near Anderson and fast- growing Union Township
• Property is just a quarter mile west of the I-275/ Ohio Pike Interchange with roughly 30,000VPD on Ohio Pike
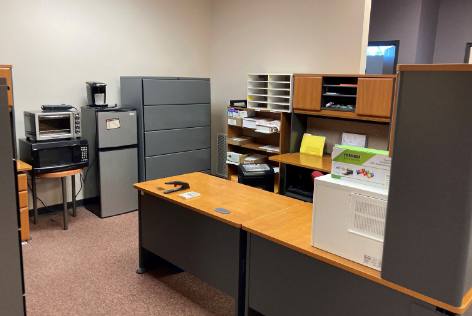
Additional Photos

Listing Agents

John Thompson
O: 513-588-1842
M: 513-703-2500
jthompson@lee-associates.com
O: 513-588-1842
M: 513-703-2500
jthompson@lee-associates.com

Chris Nachtrab
O: 513-588-1841
M: 513-604-1899
cnachtrab@lee-associates.com
O: 513-588-1841
M: 513-604-1899
cnachtrab@lee-associates.com
While we strive to provide the most accurate information, all listing information, and demographic data, is provided by third-parties. As such, MyEListing will not be responsible for the accuracy of the information. It is strongly recommended that you verify all information with the listing agent, and any relevant agencies, prior to making any decisions.