Office Space
100-300 Techne Center Drive Milford, OH 45150
100-300 Techne Center Drive Milford, OH 45150
Details & Description
Property Highlights
• Close to numerous amenities, including Walmart, Target, Cinemark, Buffalo Wild Wings, and more
• Traffic Counts(US- 50: 9,895VPD)(I - 275: 68, 20VP)
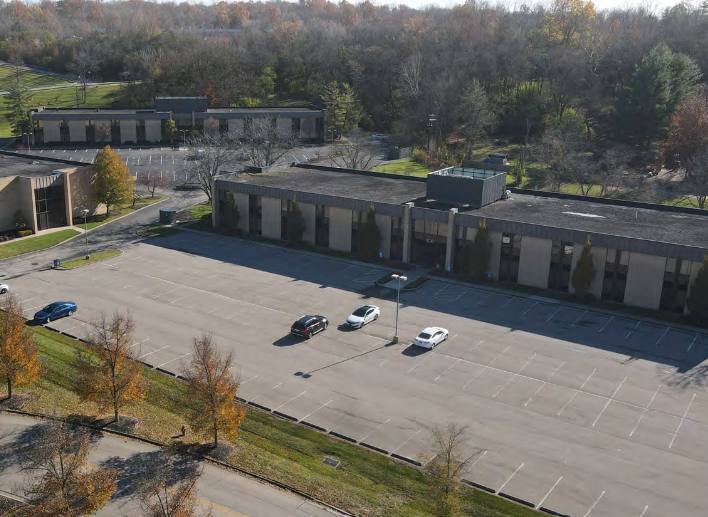
Additional Photos


Listing Agents

Dan McDonald
O: 513-588-1113
M: 513-608-2984
dan.mcdonald@lee-associates.com
O: 513-588-1113
M: 513-608-2984
dan.mcdonald@lee-associates.com

Stewart Devitt
O: 513-588-1115
stewart.devitt@lee-associates.com
O: 513-588-1115
stewart.devitt@lee-associates.com
While we strive to provide the most accurate information, all listing information, and demographic data, is provided by third-parties. As such, MyEListing will not be responsible for the accuracy of the information. It is strongly recommended that you verify all information with the listing agent, and any relevant agencies, prior to making any decisions.


