Commercial Land
Parkside Drive State RTE. 741 Mason, OH 45040
Parkside Drive State RTE. 741 Mason, OH 45040
Details & Description
Property Highlights
• Located in Mason, one of Cincinnati's most affluent communities and home to Mason City Schools, named #11 in the U
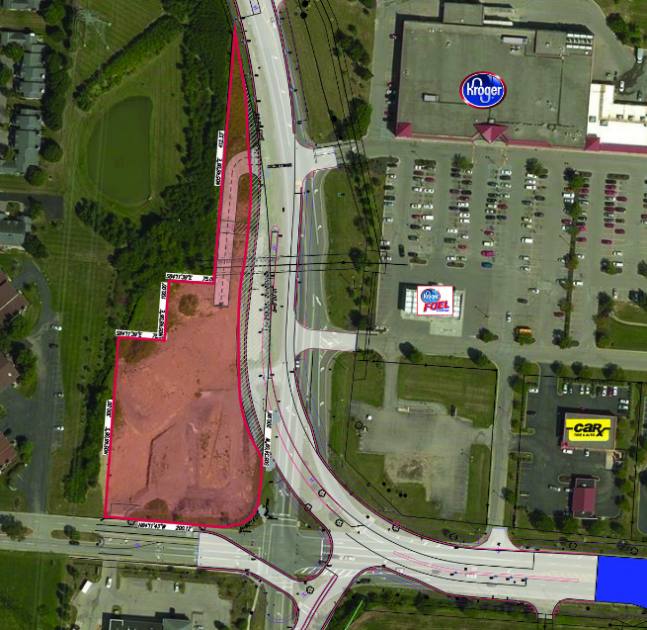
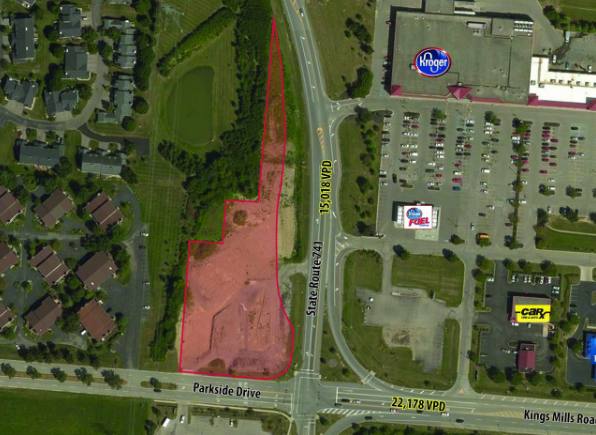
• 800" Frontage on State Rte. 741
Listing Agents

Stewart Devitt
O: 513-588-1115
stewart.devitt@lee-associates.com
O: 513-588-1115
stewart.devitt@lee-associates.com

Dan McDonald
O: 513-588-1113
M: 513-608-2984
dan.mcdonald@lee-associates.com
O: 513-588-1113
M: 513-608-2984
dan.mcdonald@lee-associates.com
While we strive to provide the most accurate information, all listing information, and demographic data, is provided by third-parties. As such, MyEListing will not be responsible for the accuracy of the information. It is strongly recommended that you verify all information with the listing agent, and any relevant agencies, prior to making any decisions.