Commercial Land
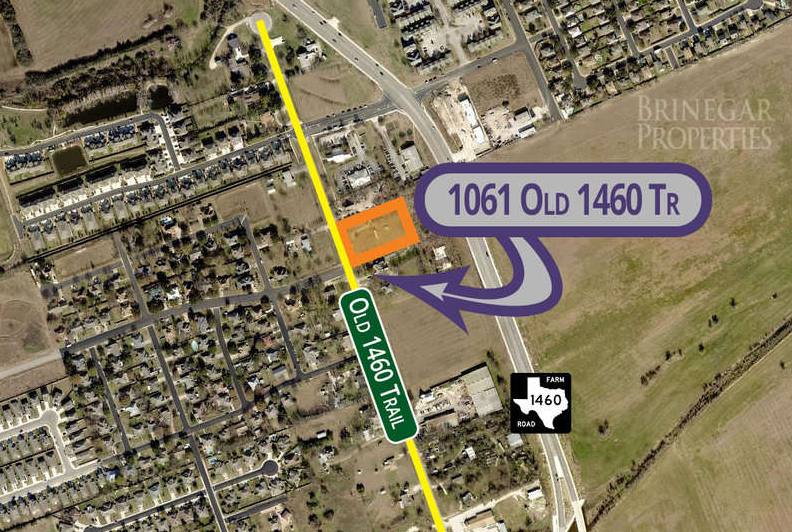
1061 Old 1460 Trail Georgetown, TX 78626
1061 Old 1460 Trail Georgetown, TX 78626

Details & Description
Property Highlights
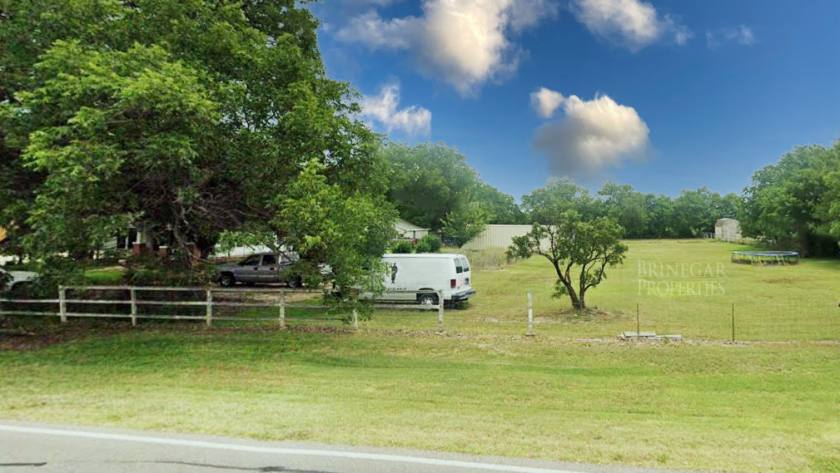
- • Existing structure 1,093 SF (WCAD)
- • Great location!
- • Southside of Georgetown
- • Easy access to IH-35, AW Grimes, and SE Loop
- • Water and sewer at the property
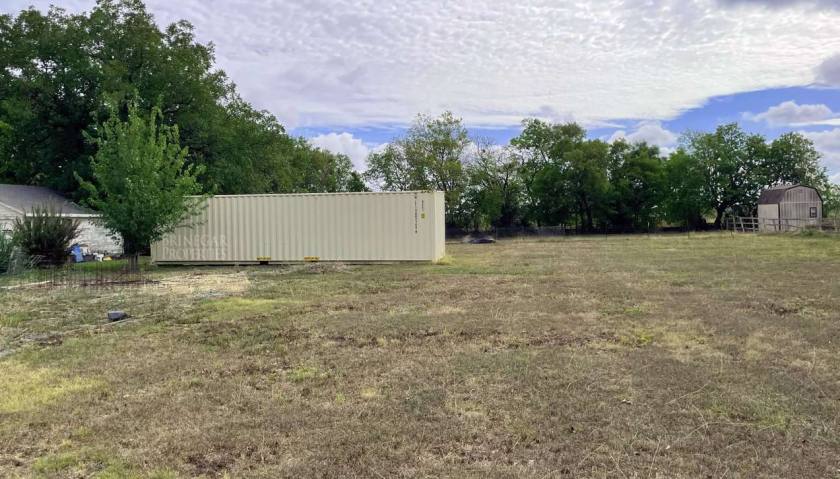
Additional Photos

Listing Agents

Dan Mishler
O: 512-940-0188
M: 512-983-6590
dmishler@512texas.com
O: 512-940-0188
M: 512-983-6590
dmishler@512texas.com
While we strive to provide the most accurate information, all listing information, and demographic data, is provided by third-parties. As such, MyEListing will not be responsible for the accuracy of the information. It is strongly recommended that you verify all information with the listing agent, and any relevant agencies, prior to making any decisions.


