2 buildings available
Highway 290 Visibility
No Zoning – Hays County
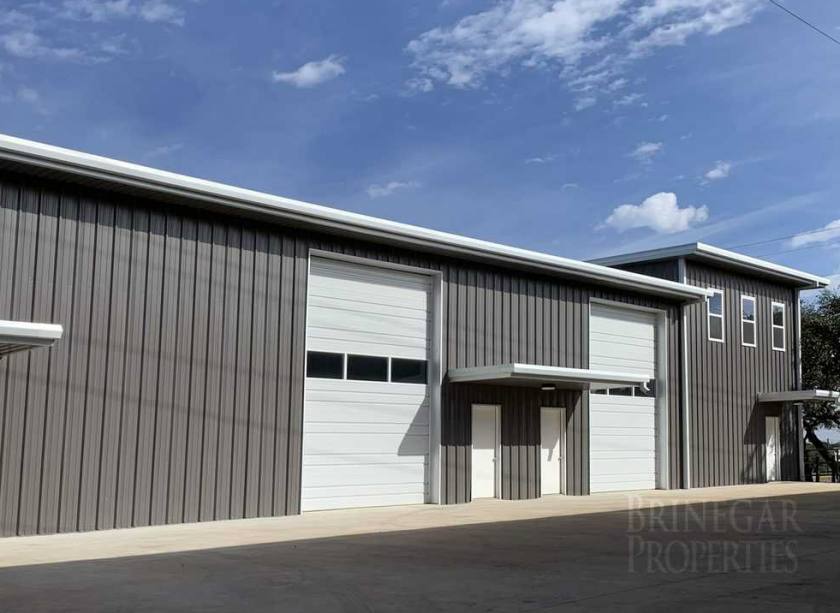
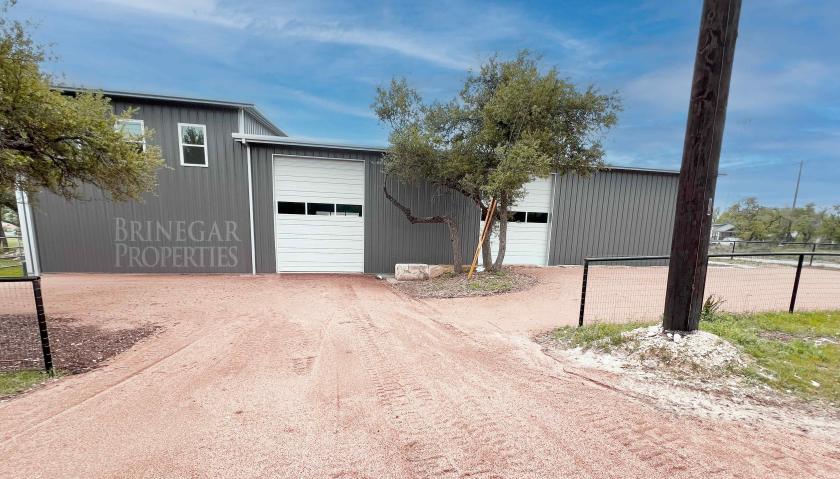
2 12×12 OH Doors on South Building
4 16×12 OH Doors on North Building
Small yard area may be available
1,000 SF fully HVAC office on the 2nd floor
Available Now
Unlock Your Business Potential!
Looking for the perfect space to elevate your business? Look no further! Brinegar Properties presents an exceptional opportunity featuring two buildings ranging from 2,000 to 14,000 square feet each. Whether you're aiming to lease or buy, we have options tailored to suit your needs!
Sale Price: $1,990,000
Strategically located with prime visibility along Highway 290, these properties offer unparalleled exposure to drive your business forward. And guess what? No zoning restrictions in Hays County mean endless possibilities for your venture!
Building Amenities:
South Building: 2 12x12 OH Doors
North Building: 4 16x12 OH Doors
Yard Space:
Available
Office Space:
Enjoy a fully HVAC-equipped 1,000 SF office on the 2nd floor, perfect for your administrative needs.
Don't miss out on this golden opportunity to secure your spot in a thriving commercial landscape. Contact us today to schedule a viewing and let's take your business to new heights with Brinegar Properties!
2,000 to 14,000 SF
2 buildings available
Highway 290 Visibility
No Zoning - Hays County
2 12x12 OH Doors on South Building
4 16x12 OH Doors on North Building
1,000 SF fully HVAC office on 2nd floor
Additional parking and yard space now available
ALSO FOR LEASE: Lease Rate: $10-$12/SF + NNN
No part of this information may be copied, reproduced, repurposed, or screen-captured for any commercial purpose without prior written authorization from MyEListing.
While we strive to provide the most accurate information, all listing information, and demographic data, is provided by third-parties. As such, MyEListing will not be responsible for the accuracy of the information. It is strongly recommended that you verify all information with the listing agent, and any relevant agencies, prior to making any decisions.
What is the asking price for 133 Glosson Ranch Road in Dripping Springs?
The asking price for 133 Glosson Ranch Road is $1,990,000
What is the building size of this Industrial property in Dripping Springs, TX?
The size of the building/unit at 133 Glosson Ranch Road in Dripping Springs is 14,000 square feet
What kind of Industrial is the propery at 133 Glosson Ranch Road?
The property at 133 Glosson Ranch Road Dripping Springs, TX 78620 is listed as a Warehouse Industrial property
What is the population within 1 mile of 133 Glosson Ranch Road in Dripping Springs?
The population within 1 mile of 133 Glosson Ranch Road Dripping Springs, TX 78620 is 134 people.
Who do I contact for questions about 133 Glosson Ranch Road?
You should contact the listing agent,
Megan Ford, for any details regarding this commercial listing.