Specialty Real Estate
14515 OConnor Road San Antonio, TX 78247
14515 OConnor Road San Antonio, TX 78247

Details & Description
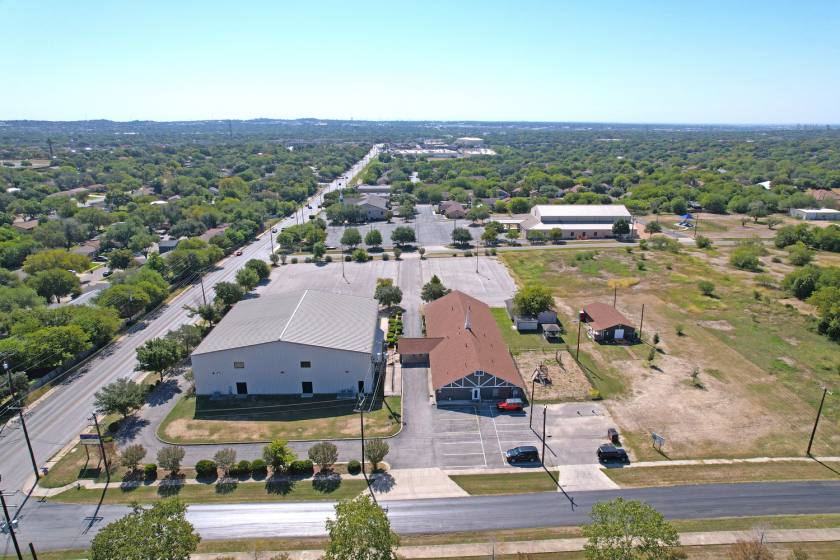
Property Highlights
- • Near James Madison High School
- • On O’Connor near Stahl Road
- • Two hard corners
- • Large, paved parking
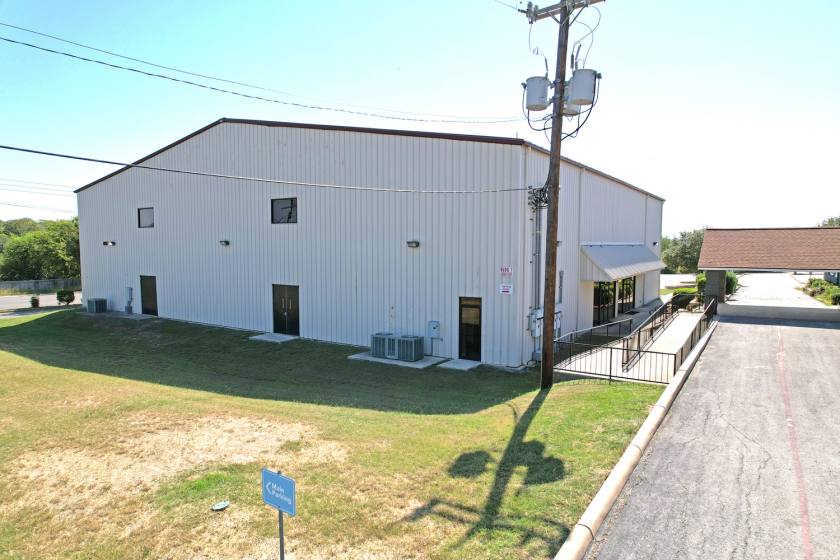
- • Large auditorium
- • Separate office & classroom building
Additional Photos


Listing Agents

John Cannon
O: 210-222-2424
M: 210-386-6410
cannon@dhrp.us
O: 210-222-2424
M: 210-386-6410
cannon@dhrp.us
While we strive to provide the most accurate information, all listing information, and demographic data, is provided by third-parties. As such, MyEListing will not be responsible for the accuracy of the information. It is strongly recommended that you verify all information with the listing agent, and any relevant agencies, prior to making any decisions.