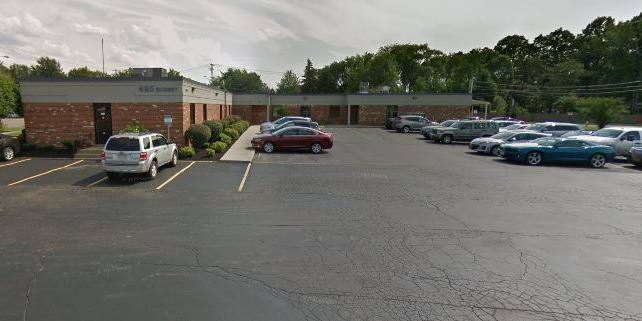
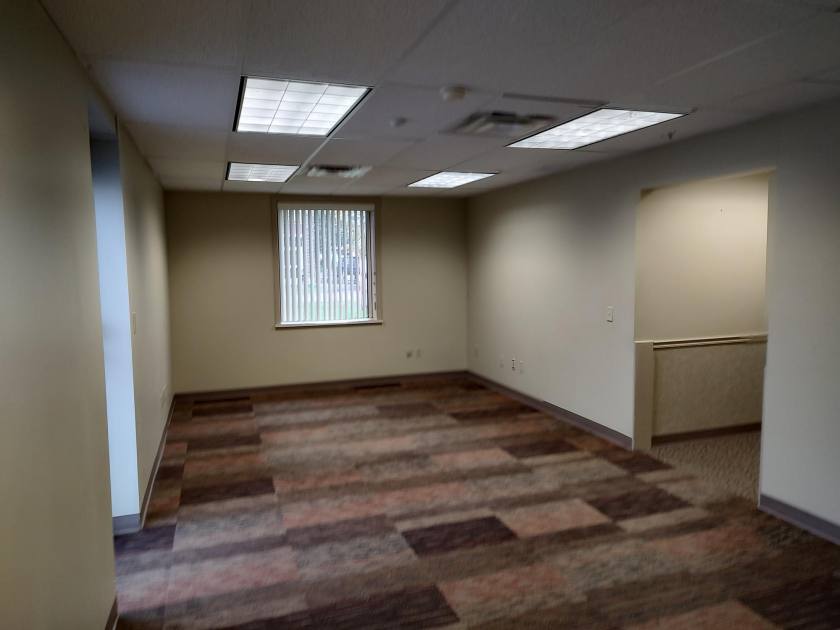
Office Space
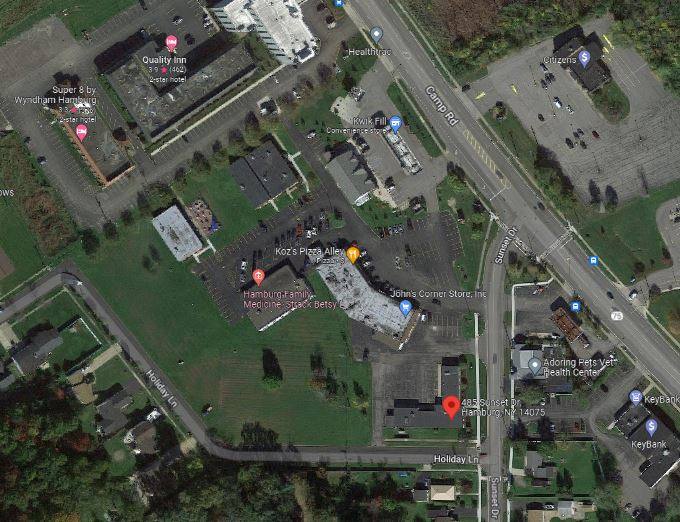
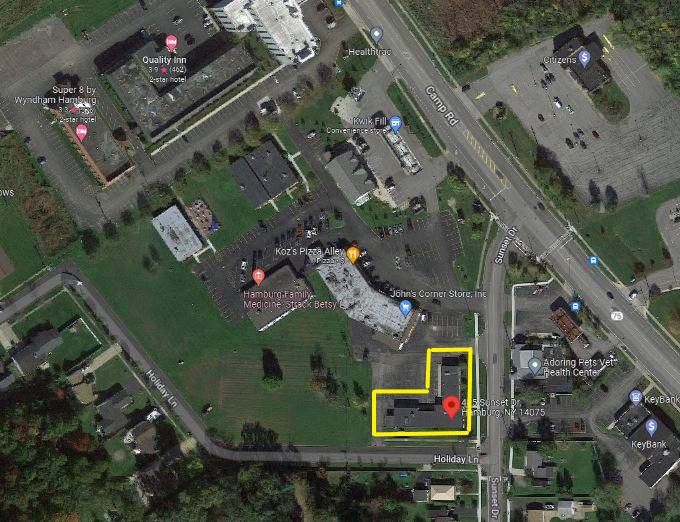
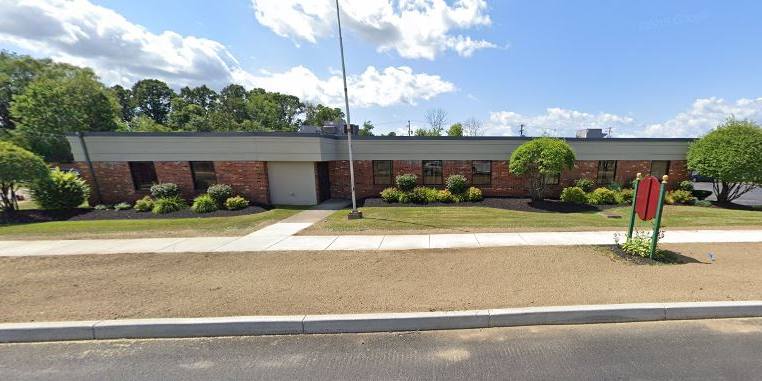
485 Sunset Drive Hamburg, NY 14075
485 Sunset Drive Hamburg, NY 14075

Details & Description
Property Highlights
- • (2) 2,400+/- SF Office Spaces
- • 5,100+/- SF Stand Alone Building
- • 7,748+/- SF Gym
- • Features reception area
- • Located 20 minutes from Downtown Buffalo
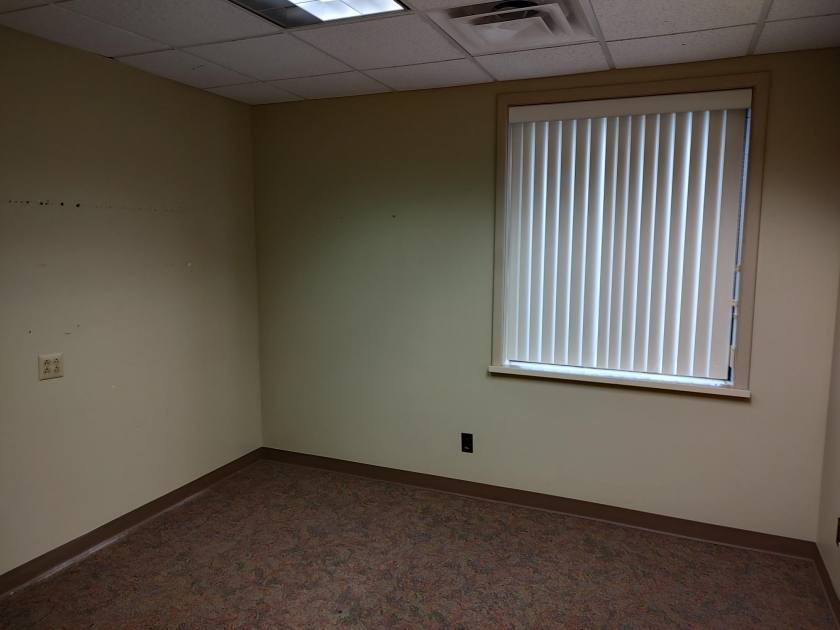
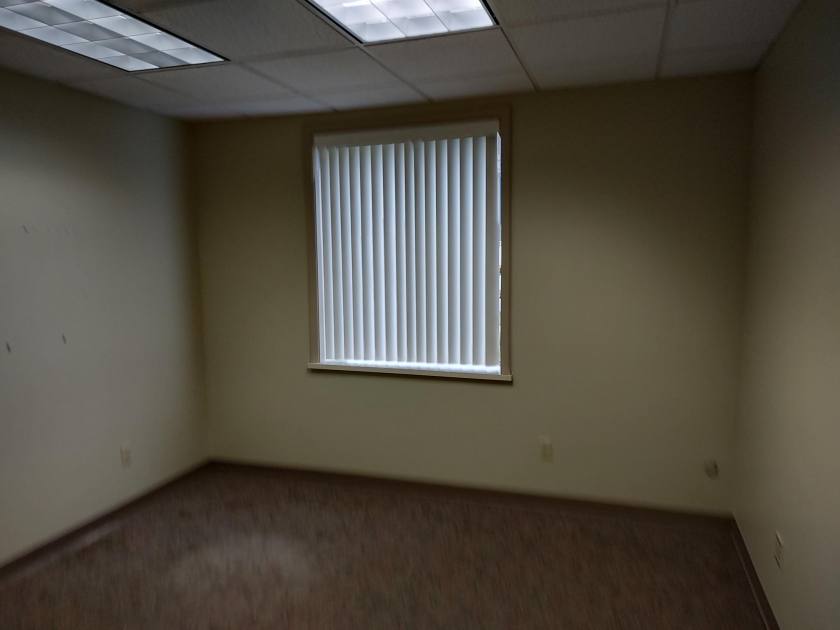
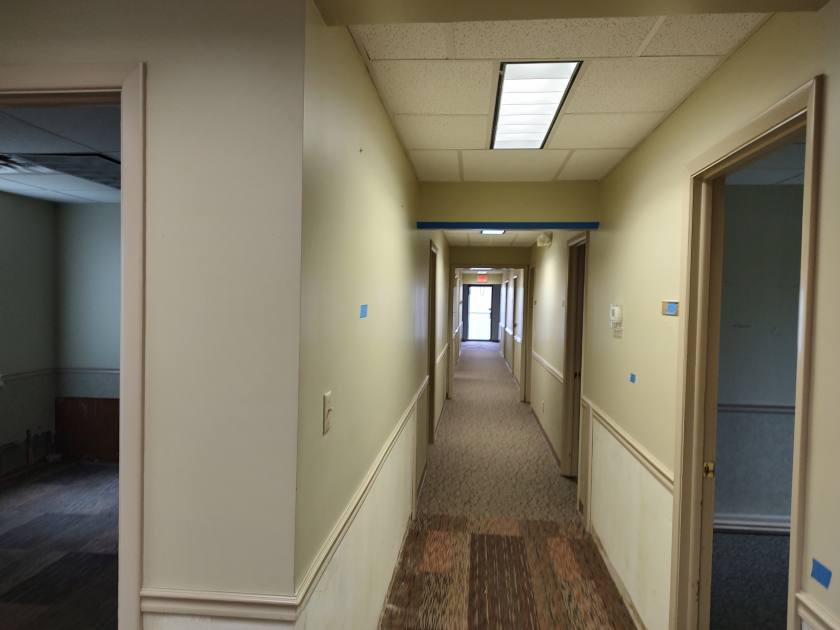
- • Several Private Offices
Additional Photos
Listing Agents

Rick Recckio
O: 716-631-5555
M: 716-998-4422
rick@recckio.com
O: 716-631-5555
M: 716-998-4422
rick@recckio.com
While we strive to provide the most accurate information, all listing information, and demographic data, is provided by third-parties. As such, MyEListing will not be responsible for the accuracy of the information. It is strongly recommended that you verify all information with the listing agent, and any relevant agencies, prior to making any decisions.