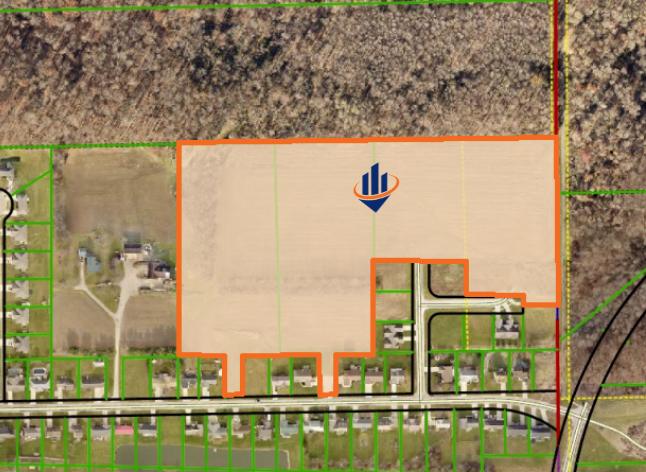
1-Mile | 3-Miles | 5-Miles | ||
---|---|---|---|---|
Total Population | 1,293 | 18,816 | 53,459 | |
Population Median Age | 46 | 40 | 40 | |
Population by Age | 0-9 Yrs | 60 (4%) | 2080 (11%) | 5841 (10%) |
10-19 Yrs | 192 (14%) | 2551 (13%) | 6182 (11%) | |
20-29 Yrs | 183 (14%) | 2829 (15%) | 8497 (15%) | |
30-39 Yrs | 128 (9%) | 2252 (11%) | 6861 (12%) | |
40-49 Yrs | 127 (9%) | 1906 (10%) | 6446 (12%) | |
50-59 Yrs | 155 (11%) | 2509 (13%) | 6820 (12%) | |
60-69 Yrs | 148 (11%) | 2189 (11%) | 6312 (11%) | |
70+ Yrs | 302 (23%) | 2498 (13%) | 6501 (12%) | |
Median HH Income | $33,309 | $42,498 | $39,537 | |
Total Household Income | < 24K | 174 (30%) | 2308 (29%) | 6455 (31%) |
25-49K | 169 (29%) | 1965 (25%) | 5848 (28%) | |
50-74K | 113 (19%) | 1544 (20%) | 3815 (18%) | |
75-99K | 46 (8%) | 865 (11%) | 2085 (10%) | |
100-199K | 61 (10%) | 889 (11%) | 2105 (10%) | |
200K+ | 3 (0%) | 132 (1%) | 370 (1%) | |
Highest Education Level | No Diploma | 208 | 1678 | 5400 |
Diploma or GED | 400 | 4892 | 14787 | |
Some College | 151 | 2761 | 8079 | |
Assoc. Degree | 65 | 1200 | 3314 | |
Bachelors Degree | 78 | 1441 | 3774 | |
Higher Degree | 40 | 658 | 1946 | |
Total Housing Units | 634 | 8,892 | 23,932 | |
--Owner-Occupied | 265 | 4,424 | 11,600 | |
--Renter-Occupied | 301 | 3,280 | 9,078 | |
Owner-Occupied Values | < 100K | 131 | 2598 | 6567 |
100-199K | 94 | 1393 | 3805 | |
200-299K | 38 | 238 | 759 | |
300-399K | 0 | 54 | 198 | |
400-499K | 0 | 42 | 114 | |
500K+ | 3 | 98 | 156 | |
Total Working Age Population | 1,127 | 15,010 | 43,778 | |
In Work Force | 620 | 9,048 | 21,862 | |
Not In Work Force | 507 | 5,962 | 21,916 | |
Workforce Employed | 577 | 8,147 | 19,886 | |
Workforce Unemployed | 41 | 870 | 1,929 | |
Civlian Workforce | 618 | 9,017 | 21,815 | |
Military Workforce | 2 | 31 | 47 | |
Total Households | 566 | 7,704 | 20,678 | |
Family Households | 323 | 4,721 | 11,471 | |
Non-Family Households | 243 | 2,983 | 9,207 | |
Married Couple | 251 | 3,178 | 7,300 | |
Other Family | 72 | 1,543 | 4,171 | |
Married w/Child | 59 | 956 | 2,193 | |
Single Male w/Child | 8 | 211 | 458 | |
Single Female w/Child | 8 | 628 | 1,719 |
Population Change Last Two Decades - Plus Projection
2000 | % | 2010 | % | 2020 | % | 2030 | |
---|---|---|---|---|---|---|---|
Ohio | 11,353,140 | +2 | 11,536,504 | 0 | 11,574,870 | 0 | 11,615,100 |
Richland County | 128,852 | -3 | 124,475 | -3 | 120,200 | -3 | 116,640 |
Total Working Age Population:
Total Households:
Total Working Age Population:
Total Households:
Total Working Age Population:
Total Households: