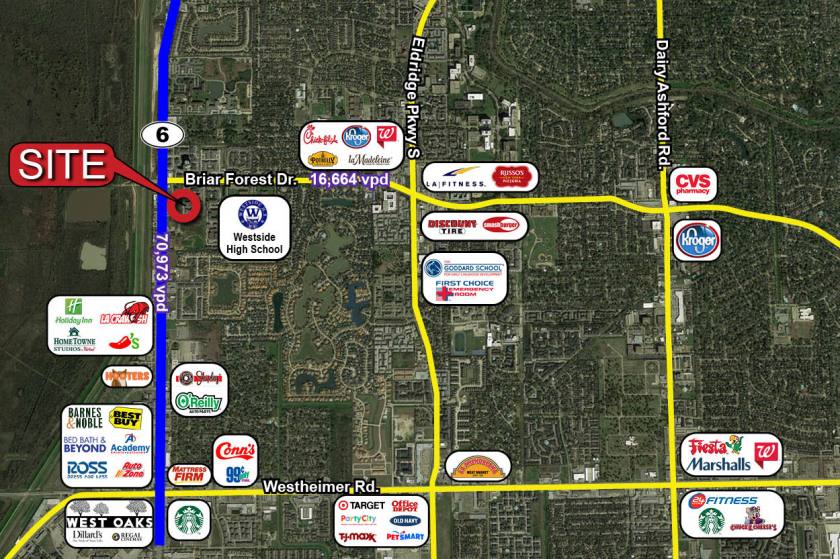
1-Mile | 3-Miles | 5-Miles | ||
---|---|---|---|---|
Total Population | 9,901 | 90,642 | 289,351 | |
Population Median Age | 39 | 36 | 36 | |
Population by Age | 0-9 Yrs | 1343 (13%) | 12004 (13%) | 40556 (14%) |
10-19 Yrs | 854 (8%) | 9369 (10%) | 36019 (12%) | |
20-29 Yrs | 1095 (11%) | 15543 (17%) | 44525 (15%) | |
30-39 Yrs | 2459 (24%) | 17397 (19%) | 46516 (16%) | |
40-49 Yrs | 1020 (10%) | 11381 (12%) | 38299 (13%) | |
50-59 Yrs | 617 (6%) | 9318 (10%) | 33852 (11%) | |
60-69 Yrs | 1182 (11%) | 9113 (10%) | 28324 (9%) | |
70+ Yrs | 1330 (13%) | 6516 (7%) | 21260 (7%) | |
Median HH Income | $78,183 | $61,878 | $62,236 | |
Total Household Income | < 24K | 413 (9%) | 6095 (15%) | 18837 (17%) |
25-49K | 932 (22%) | 9814 (24%) | 26381 (24%) | |
50-74K | 697 (16%) | 7837 (19%) | 18775 (17%) | |
75-99K | 377 (9%) | 4546 (11%) | 12972 (11%) | |
100-199K | 1053 (25%) | 7076 (17%) | 21032 (19%) | |
200K+ | 707 (16%) | 4030 (10%) | 11345 (10%) | |
Highest Education Level | No Diploma | 321 | 4444 | 23793 |
Diploma or GED | 502 | 9605 | 34509 | |
Some College | 1067 | 11178 | 38437 | |
Assoc. Degree | 788 | 5949 | 14620 | |
Bachelors Degree | 2631 | 20733 | 52696 | |
Higher Degree | 2142 | 11651 | 29510 | |
Total Housing Units | 4,610 | 44,963 | 121,650 | |
--Owner-Occupied | 1,773 | 14,265 | 50,733 | |
--Renter-Occupied | 2,405 | 25,133 | 58,609 | |
Owner-Occupied Values | < 100K | 34 | 617 | 4274 |
100-199K | 188 | 4481 | 18188 | |
200-299K | 446 | 3255 | 9952 | |
300-399K | 357 | 2053 | 6738 | |
400-499K | 295 | 1200 | 3606 | |
500K+ | 454 | 2659 | 7975 | |
Total Working Age Population | 8,029 | 72,673 | 226,201 | |
In Work Force | 5,040 | 51,945 | 156,385 | |
Not In Work Force | 2,989 | 20,728 | 69,816 | |
Workforce Employed | 4,527 | 49,071 | 148,064 | |
Workforce Unemployed | 426 | 2,693 | 7,949 | |
Civlian Workforce | 4,953 | 51,765 | 156,013 | |
Military Workforce | 87 | 180 | 372 | |
Total Households | 4,178 | 39,399 | 109,342 | |
Family Households | 2,472 | 22,654 | 72,086 | |
Non-Family Households | 1,706 | 16,744 | 37,256 | |
Married Couple | 2,027 | 15,295 | 50,965 | |
Other Family | 445 | 7,359 | 21,121 | |
Married w/Child | 817 | 6,347 | 22,509 | |
Single Male w/Child | 85 | 441 | 2,103 | |
Single Female w/Child | 200 | 3,319 | 9,306 |
Population Change Last Two Decades - Plus Projection
2000 | % | 2010 | % | 2020 | % | 2030 | |
---|---|---|---|---|---|---|---|
Texas | 20,851,820 | +21 | 25,145,561 | +18 | 29,677,668 | +18 | 34,894,452 |
Fort Bend County | 354,452 | +65 | 585,375 | +44 | 840,383 | +43 | 1,203,029 |
Harris County | 3,400,578 | +20 | 4,092,459 | +22 | 4,978,845 | +19 | 5,924,750 |
Total Working Age Population:
Total Households:
Total Working Age Population:
Total Households:
Total Working Age Population:
Total Households: