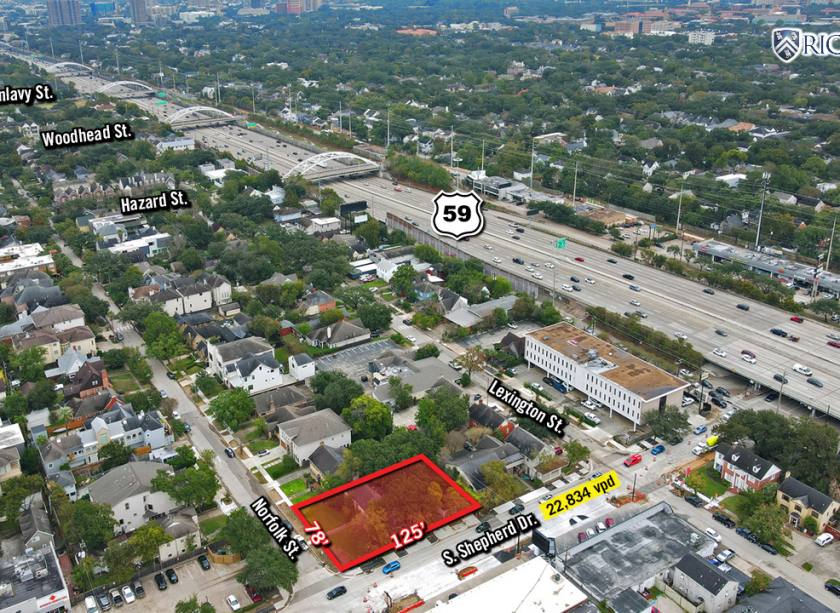
1-Mile | 3-Miles | 5-Miles | ||
---|---|---|---|---|
Total Population | 26,603 | 193,740 | 465,799 | |
Population Median Age | 40 | 38 | 37 | |
Population by Age | 0-9 Yrs | 2188 (8%) | 17439 (9%) | 48783 (10%) |
10-19 Yrs | 1875 (7%) | 12891 (6%) | 39705 (8%) | |
20-29 Yrs | 5520 (20%) | 46131 (23%) | 98499 (21%) | |
30-39 Yrs | 5116 (19%) | 40011 (20%) | 92574 (19%) | |
40-49 Yrs | 3339 (12%) | 22560 (11%) | 57916 (12%) | |
50-59 Yrs | 2915 (10%) | 20772 (10%) | 50364 (10%) | |
60-69 Yrs | 3026 (11%) | 18912 (9%) | 42886 (9%) | |
70+ Yrs | 2623 (9%) | 15024 (7%) | 35071 (7%) | |
Median HH Income | $102,659 | $95,356 | $80,593 | |
Total Household Income | < 24K | 1563 (11%) | 12589 (12%) | 36603 (17%) |
25-49K | 1520 (10%) | 12026 (12%) | 33766 (15%) | |
50-74K | 2093 (14%) | 15696 (15%) | 32165 (14%) | |
75-99K | 1740 (12%) | 11302 (11%) | 22777 (10%) | |
100-199K | 3632 (25%) | 24373 (24%) | 47382 (22%) | |
200K+ | 3531 (25%) | 23043 (23%) | 42568 (19%) | |
Highest Education Level | No Diploma | 290 | 3292 | 27474 |
Diploma or GED | 967 | 8320 | 37952 | |
Some College | 1737 | 15101 | 42462 | |
Assoc. Degree | 605 | 5670 | 15032 | |
Bachelors Degree | 7641 | 55463 | 111341 | |
Higher Degree | 9173 | 58143 | 104662 | |
Total Housing Units | 15,937 | 113,450 | 247,036 | |
--Owner-Occupied | 5,289 | 39,007 | 87,063 | |
--Renter-Occupied | 8,789 | 60,023 | 128,199 | |
Owner-Occupied Values | < 100K | 56 | 1166 | 4837 |
100-199K | 150 | 2722 | 9749 | |
200-299K | 269 | 3764 | 9906 | |
300-399K | 684 | 5620 | 12712 | |
400-499K | 461 | 4101 | 9903 | |
500K+ | 3669 | 21634 | 39956 | |
Total Working Age Population | 23,195 | 168,540 | 393,769 | |
In Work Force | 16,803 | 122,927 | 274,070 | |
Not In Work Force | 6,392 | 45,613 | 119,699 | |
Workforce Employed | 16,412 | 118,377 | 261,829 | |
Workforce Unemployed | 339 | 4,450 | 11,964 | |
Civlian Workforce | 16,751 | 122,826 | 273,793 | |
Military Workforce | 52 | 100 | 277 | |
Total Households | 14,078 | 99,030 | 215,261 | |
Family Households | 6,011 | 40,785 | 98,688 | |
Non-Family Households | 8,066 | 58,245 | 116,573 | |
Married Couple | 5,114 | 34,462 | 75,958 | |
Other Family | 898 | 6,324 | 22,730 | |
Married w/Child | 1,625 | 11,778 | 29,151 | |
Single Male w/Child | 199 | 1,004 | 2,460 | |
Single Female w/Child | 170 | 1,829 | 7,914 |
Population Change Last Two Decades - Plus Projection
2000 | % | 2010 | % | 2020 | % | 2030 | |
---|---|---|---|---|---|---|---|
Texas | 20,851,820 | +21 | 25,145,561 | +18 | 29,677,668 | +18 | 34,894,452 |
Harris County | 3,400,578 | +20 | 4,092,459 | +22 | 4,978,845 | +19 | 5,924,750 |
Total Working Age Population:
Total Households:
Total Working Age Population:
Total Households:
Total Working Age Population:
Total Households: