Office Space
4808 Gibson Street Houston, TX 77007
4808 Gibson Street Houston, TX 77007

Details & Description
Property Highlights
- • Ample Parking
- • Elevator Access
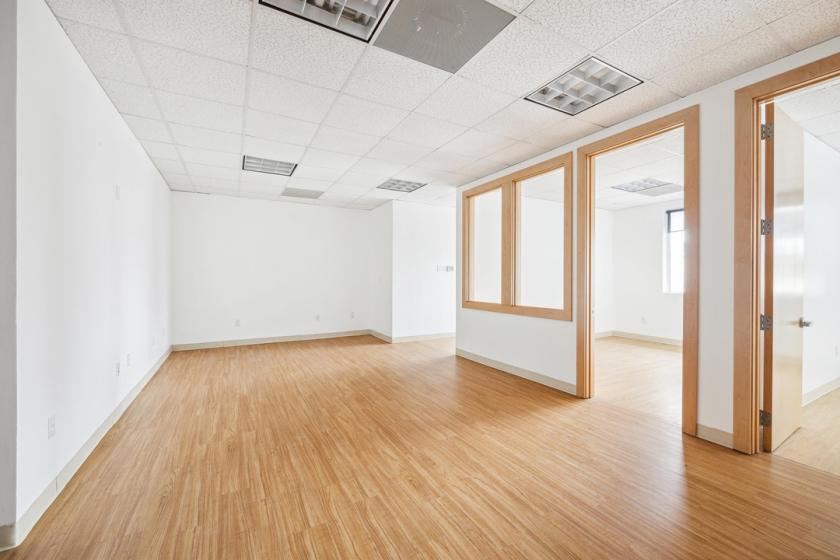
- • Executive Office Suites Available
- • Natural Light Throughout
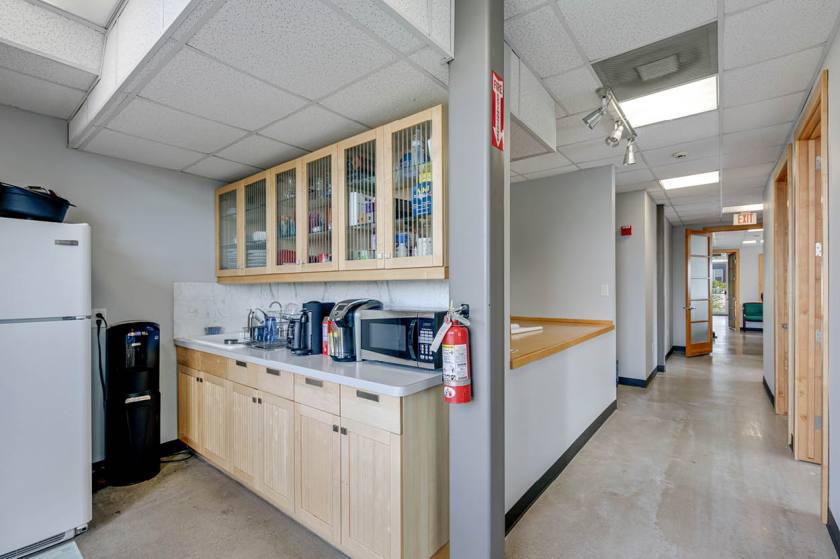
Additional Photos


Listing Agents

Ashley Casterlin
O: 832-581-3629
ashley@davis-commercial.com
O: 832-581-3629
ashley@davis-commercial.com
While we strive to provide the most accurate information, all listing information, and demographic data, is provided by third-parties. As such, MyEListing will not be responsible for the accuracy of the information. It is strongly recommended that you verify all information with the listing agent, and any relevant agencies, prior to making any decisions.


