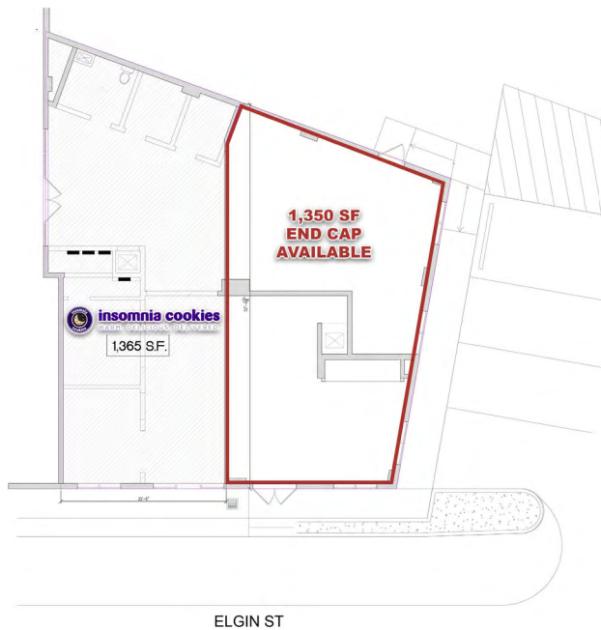
Retail Space
3509 Elgin Street Houston, TX 77004
3509 Elgin Street Houston, TX 77004

Details & Description
Property Highlights
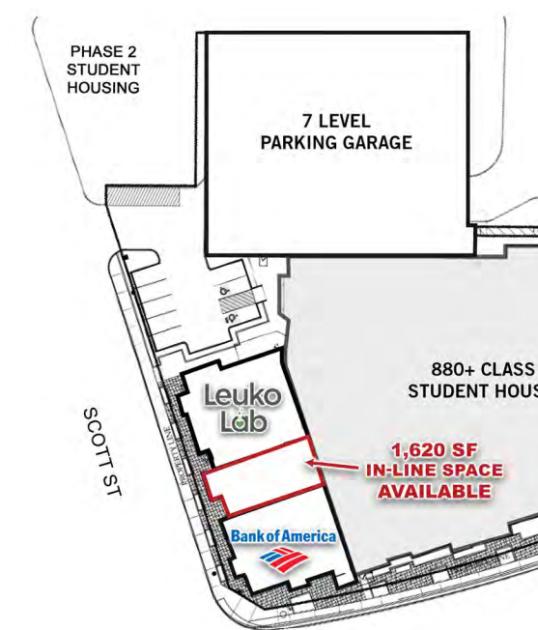
• Directly across from University of Houston campus and down the street from the Texas Southern University Campus
• 880 Bed “Class A” Student Housing (97%+ Occupancy)
Listing Agents

Ryan Neyland
O: 281-995-2200
M: 713-398-9560
ryan@palodurocp.com
O: 281-995-2200
M: 713-398-9560
ryan@palodurocp.com
While we strive to provide the most accurate information, all listing information, and demographic data, is provided by third-parties. As such, MyEListing will not be responsible for the accuracy of the information. It is strongly recommended that you verify all information with the listing agent, and any relevant agencies, prior to making any decisions.