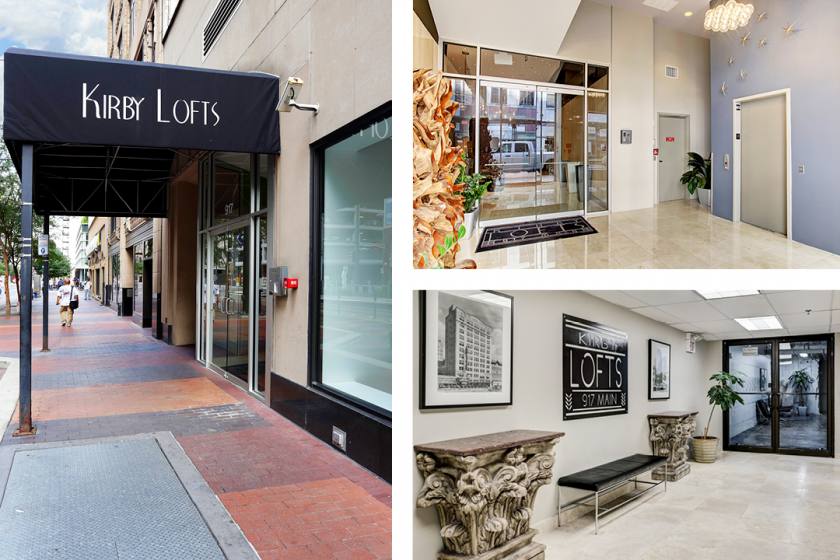
Retail Space
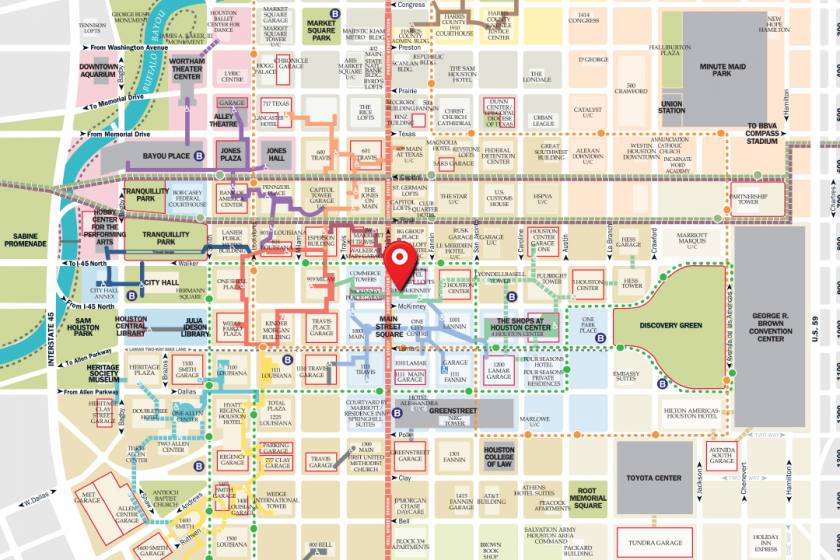
917 Main Street Houston, TX 77002
917 Main Street Houston, TX 77002
Details & Description
Property Highlights
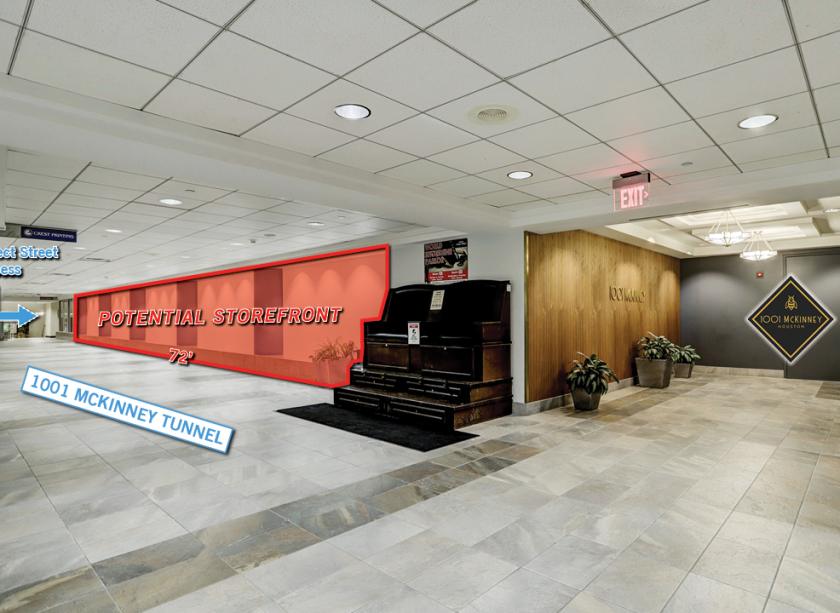
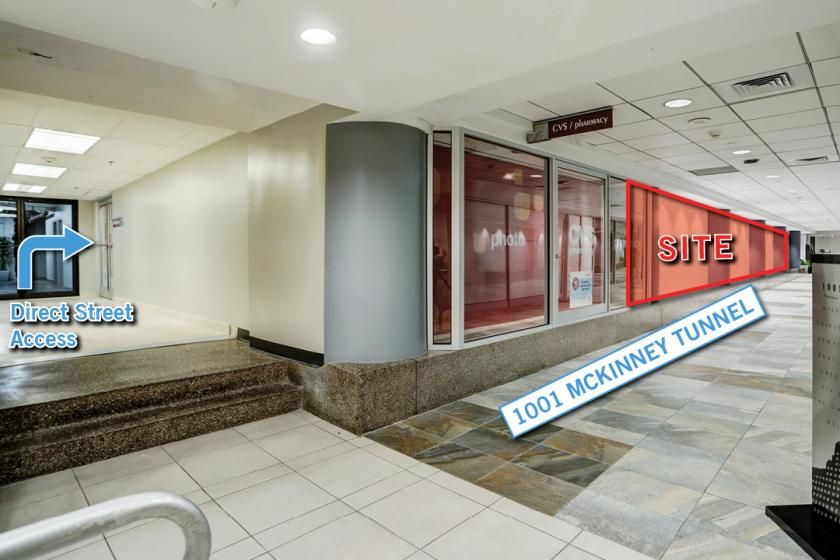
- • Potential for 72’ of Tunnel Storefront
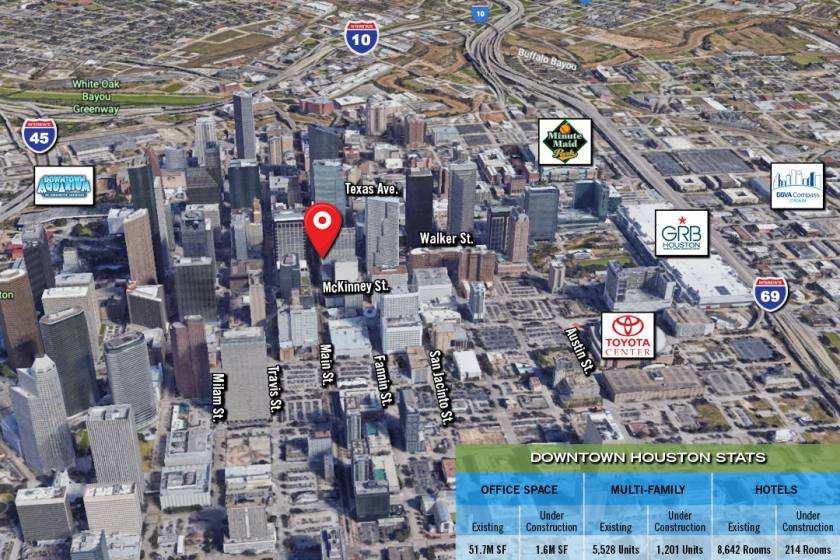
- • Daytime Population- Approx. 100,000 w/in 1 Mile
- • Owner Financing Available
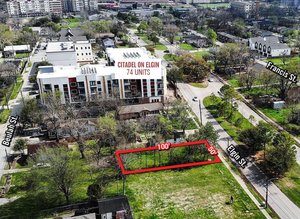
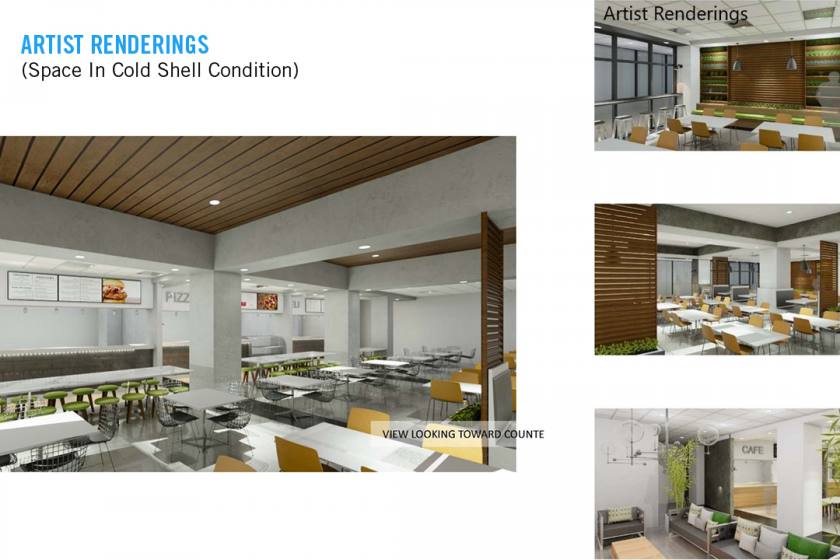
Additional Photos

Listing Agents

Ashley Casterlin
O: 832-581-3629
ashley@davis-commercial.com
O: 832-581-3629
ashley@davis-commercial.com
While we strive to provide the most accurate information, all listing information, and demographic data, is provided by third-parties. As such, MyEListing will not be responsible for the accuracy of the information. It is strongly recommended that you verify all information with the listing agent, and any relevant agencies, prior to making any decisions.