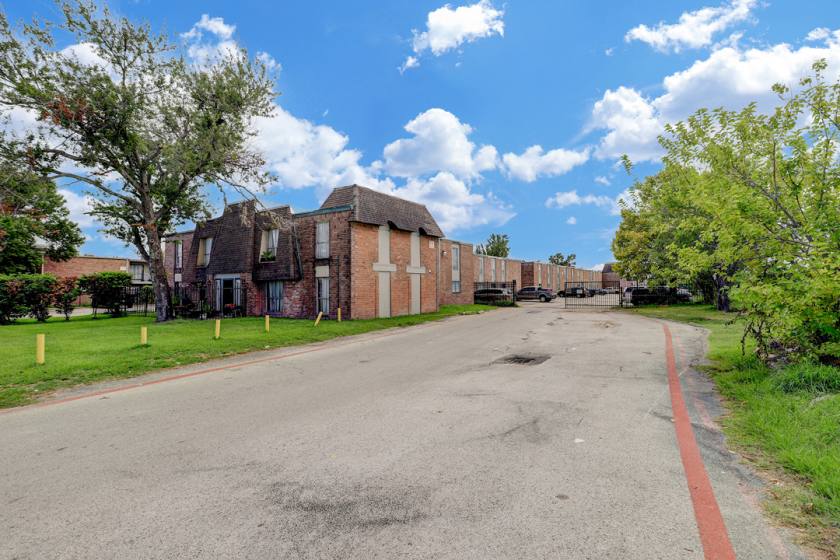
Multifamily Housing
215 West Little York Road Houston, TX 77076
215 West Little York Road Houston, TX 77076

Details & Description
Property Highlights
• On Metro Line and Across from Grocery Anchored (Food Town) Shopping Center
• 100% Occupancy (w/High Occupancy History)
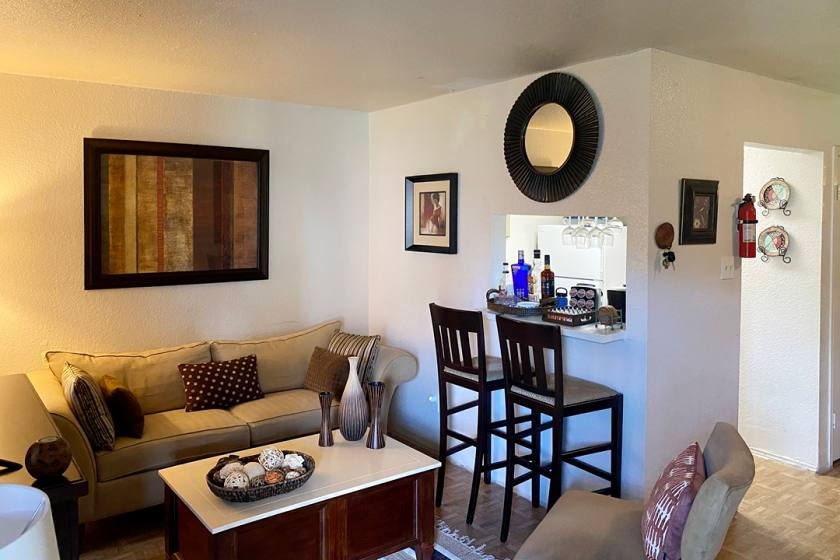
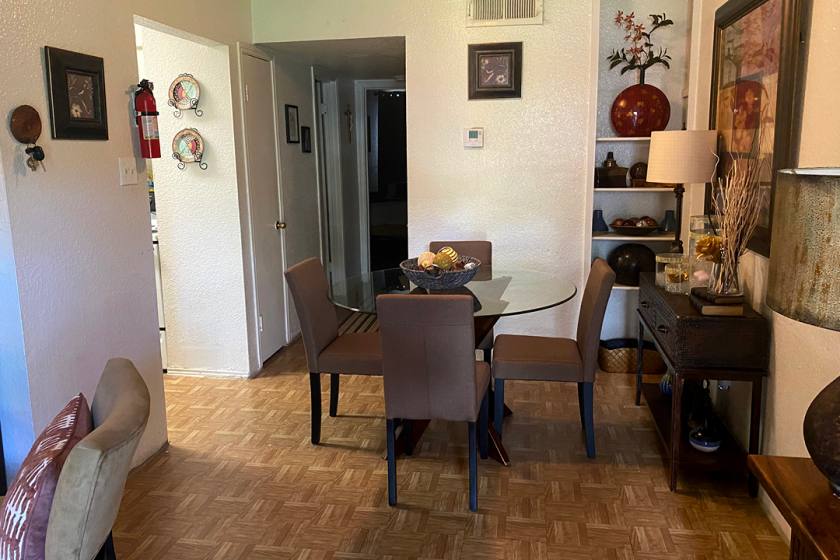
Additional Photos


Listing Agents

Ryan Neyland
O: 281-995-2200
M: 713-398-9560
ryan@palodurocp.com
O: 281-995-2200
M: 713-398-9560
ryan@palodurocp.com
While we strive to provide the most accurate information, all listing information, and demographic data, is provided by third-parties. As such, MyEListing will not be responsible for the accuracy of the information. It is strongly recommended that you verify all information with the listing agent, and any relevant agencies, prior to making any decisions.