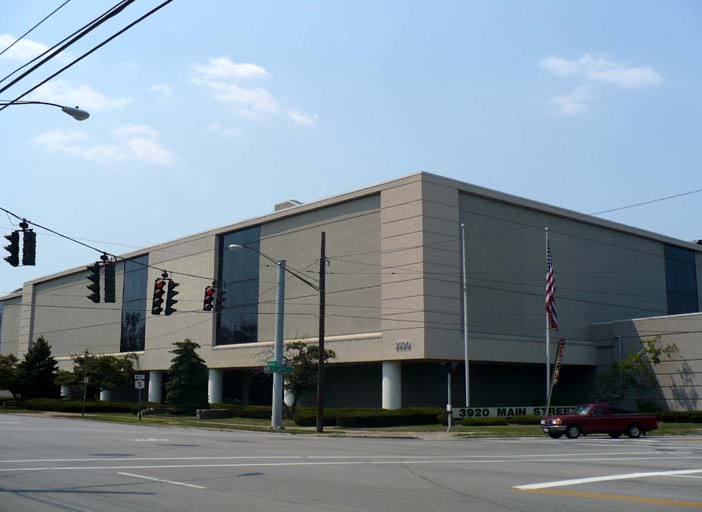
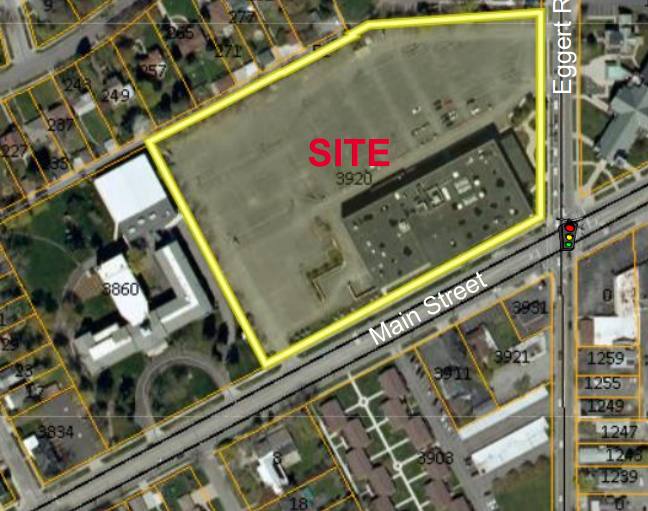
1-Mile | 3-Miles | 5-Miles | ||
---|---|---|---|---|
Total Population | 15,477 | 153,977 | 356,430 | |
Population Median Age | 39 | 38 | 39 | |
Population by Age | 0-9 Yrs | 1635 (10%) | 17611 (11%) | 39640 (11%) |
10-19 Yrs | 2360 (15%) | 19696 (12%) | 45311 (12%) | |
20-29 Yrs | 2240 (14%) | 26138 (16%) | 59314 (16%) | |
30-39 Yrs | 1892 (12%) | 22321 (14%) | 48695 (13%) | |
40-49 Yrs | 1712 (11%) | 16476 (10%) | 38053 (10%) | |
50-59 Yrs | 2276 (14%) | 18201 (11%) | 43666 (12%) | |
60-69 Yrs | 1570 (10%) | 16902 (10%) | 40264 (11%) | |
70+ Yrs | 1792 (11%) | 16632 (10%) | 41486 (11%) | |
Median HH Income | $70,406 | $57,718 | $53,912 | |
Total Household Income | < 24K | 1362 (21%) | 14819 (22%) | 37545 (24%) |
25-49K | 1043 (16%) | 13729 (20%) | 34274 (22%) | |
50-74K | 976 (15%) | 12419 (18%) | 27019 (17%) | |
75-99K | 910 (14%) | 8799 (13%) | 18973 (12%) | |
100-199K | 1398 (22%) | 12675 (19%) | 28195 (18%) | |
200K+ | 655 (10%) | 3122 (4%) | 7113 (4%) | |
Highest Education Level | No Diploma | 506 | 7488 | 20423 |
Diploma or GED | 1438 | 21694 | 57525 | |
Some College | 1618 | 19911 | 45855 | |
Assoc. Degree | 901 | 10650 | 25900 | |
Bachelors Degree | 3129 | 24723 | 51754 | |
Higher Degree | 2524 | 19250 | 40703 | |
Total Housing Units | 6,800 | 70,797 | 169,121 | |
--Owner-Occupied | 4,741 | 41,077 | 91,040 | |
--Renter-Occupied | 1,604 | 24,486 | 62,078 | |
Owner-Occupied Values | < 100K | 457 | 9599 | 23439 |
100-199K | 2845 | 21320 | 43346 | |
200-299K | 777 | 6688 | 14498 | |
300-399K | 235 | 1924 | 5267 | |
400-499K | 150 | 475 | 1567 | |
500K+ | 276 | 1070 | 2923 | |
Total Working Age Population | 12,815 | 126,023 | 293,720 | |
In Work Force | 8,280 | 78,976 | 180,763 | |
Not In Work Force | 4,535 | 47,047 | 112,957 | |
Workforce Employed | 7,865 | 74,942 | 171,059 | |
Workforce Unemployed | 398 | 3,843 | 9,355 | |
Civlian Workforce | 8,263 | 78,785 | 180,414 | |
Military Workforce | 18 | 191 | 350 | |
Total Households | 6,344 | 65,563 | 153,118 | |
Family Households | 3,865 | 36,539 | 83,400 | |
Non-Family Households | 2,479 | 29,023 | 69,718 | |
Married Couple | 2,575 | 22,690 | 52,514 | |
Other Family | 1,290 | 13,850 | 30,886 | |
Married w/Child | 1,001 | 8,372 | 19,272 | |
Single Male w/Child | 85 | 1,294 | 2,820 | |
Single Female w/Child | 470 | 5,746 | 12,221 |
Population Change Last Two Decades - Plus Projection
2000 | % | 2010 | % | 2020 | % | 2030 | |
---|---|---|---|---|---|---|---|
New York | 18,976,457 | +2 | 19,378,102 | +4 | 20,146,131 | +2 | 20,604,030 |
Erie County | 950,265 | -3 | 919,040 | +2 | 936,084 | +1 | 949,073 |
Niagara County | 219,846 | -2 | 216,469 | -3 | 209,940 | -3 | 202,950 |
Total Working Age Population:
Total Households:
Total Working Age Population:
Total Households:
Total Working Age Population:
Total Households: