Retail Space
127 West Main Street Le Roy, NY 14482
127 West Main Street Le Roy, NY 14482
Details & Description
Property Highlights
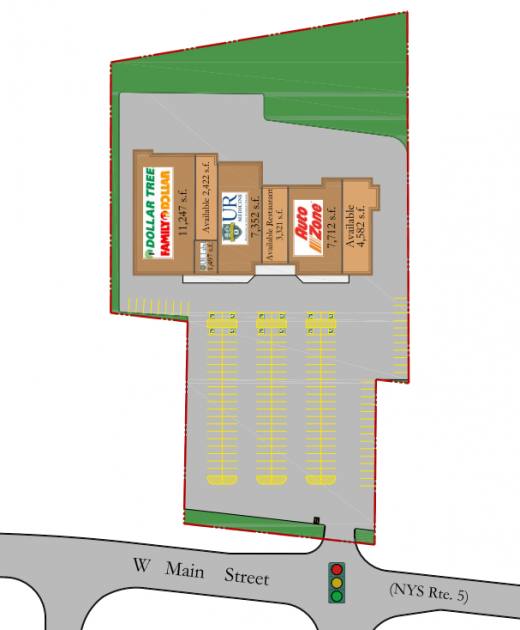
• Located west of the village of LeRoy, immediately across from, and sharing signalized access with Tops Plaza
• 2nd Generation restaurant available. Bar, private room, large walk in cooler and large Ansul/Hood system
Listing Agents

Jonathan Maurer
O: 585-248-9426
M: 585-899-9771
jmaurer@pyramidbrokerage.com
O: 585-248-9426
M: 585-899-9771
jmaurer@pyramidbrokerage.com

Christopher D. Giunta
O: 585-248-9426
M: 585-503-8553
cgiunta@pyramidbrokerage.com
O: 585-248-9426
M: 585-503-8553
cgiunta@pyramidbrokerage.com
While we strive to provide the most accurate information, all listing information, and demographic data, is provided by third-parties. As such, MyEListing will not be responsible for the accuracy of the information. It is strongly recommended that you verify all information with the listing agent, and any relevant agencies, prior to making any decisions.