Specialty Real Estate
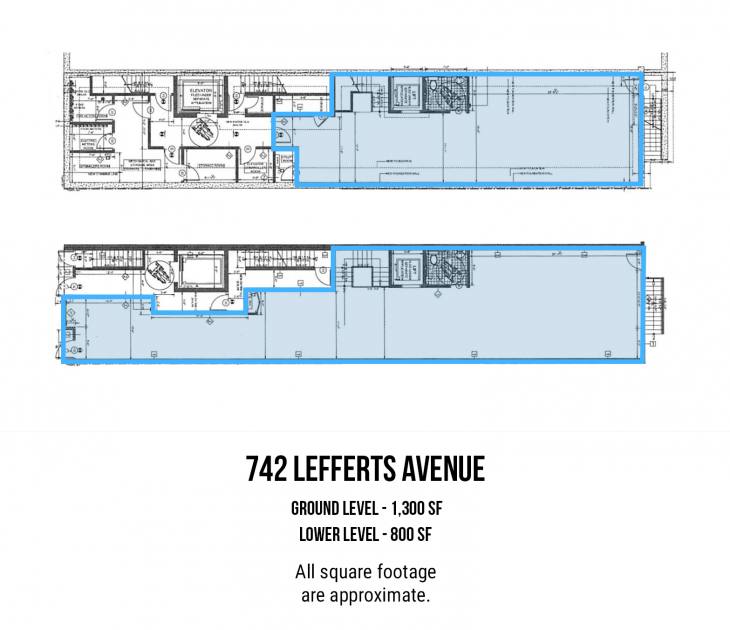
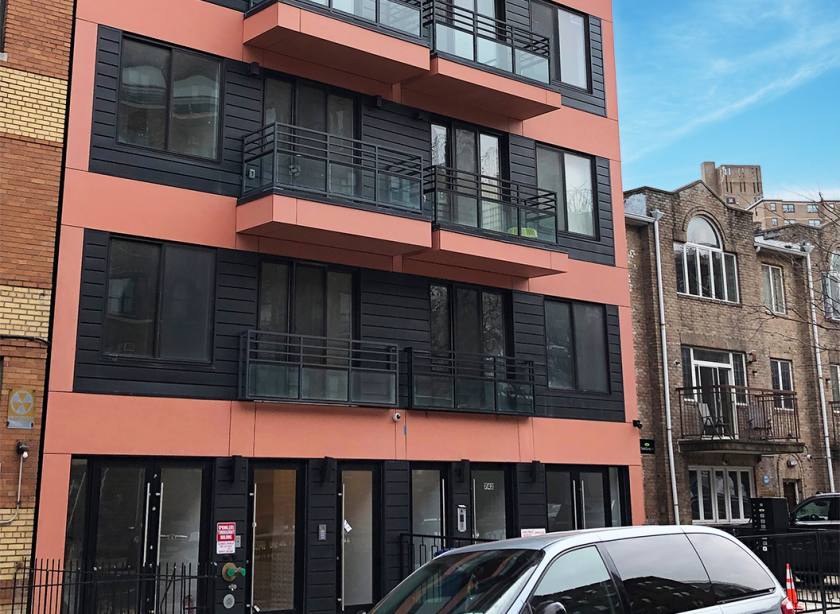
742 Lefferts Avenue Brooklyn, NY 11203
742 Lefferts Avenue Brooklyn, NY 11203
Details & Description
Property Highlights
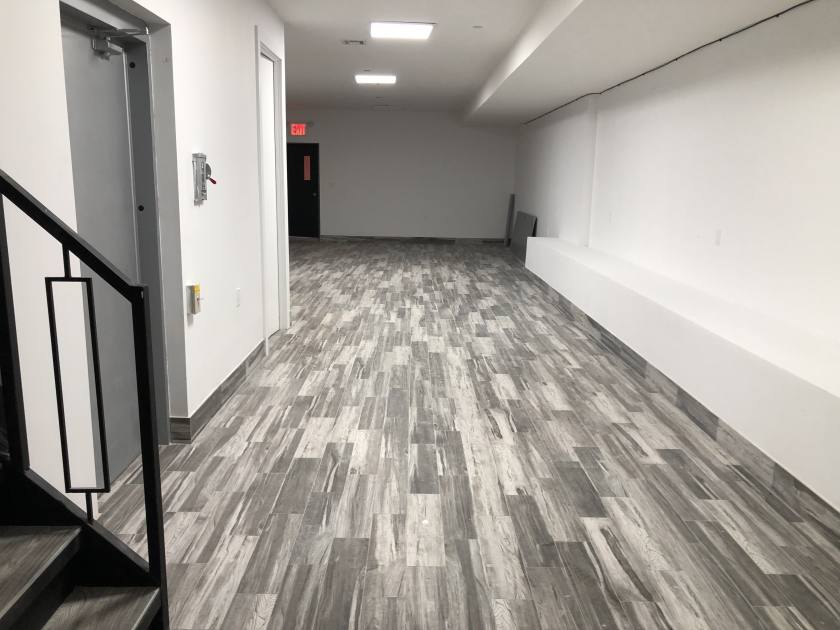
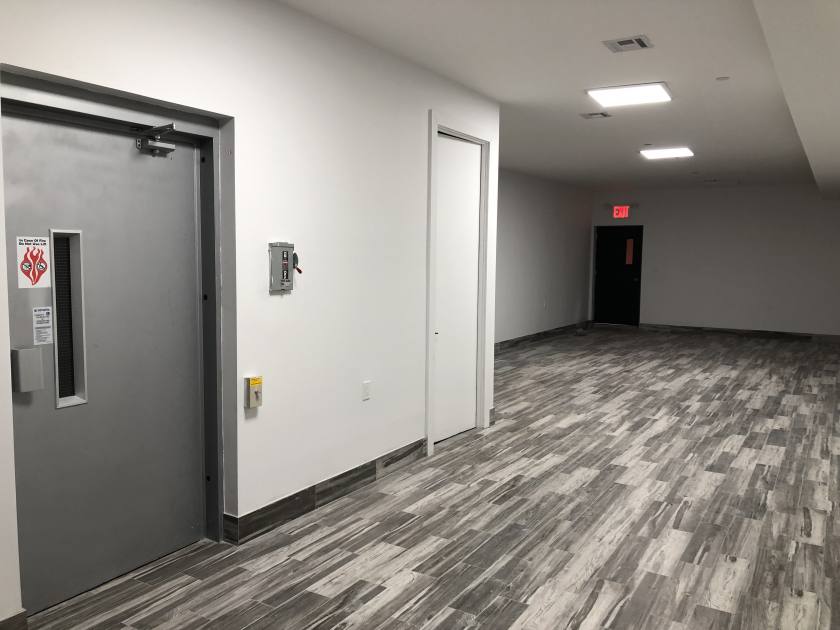
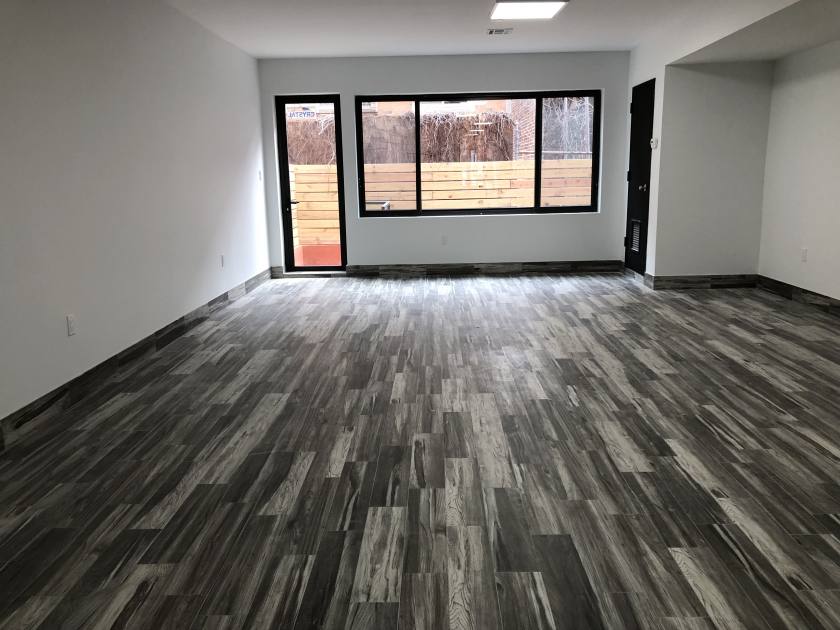
- • 1,300 SF on the ground
- • 800 SF on the lower level
- • 2 means of egress
- • Small backyard
- • Fully built
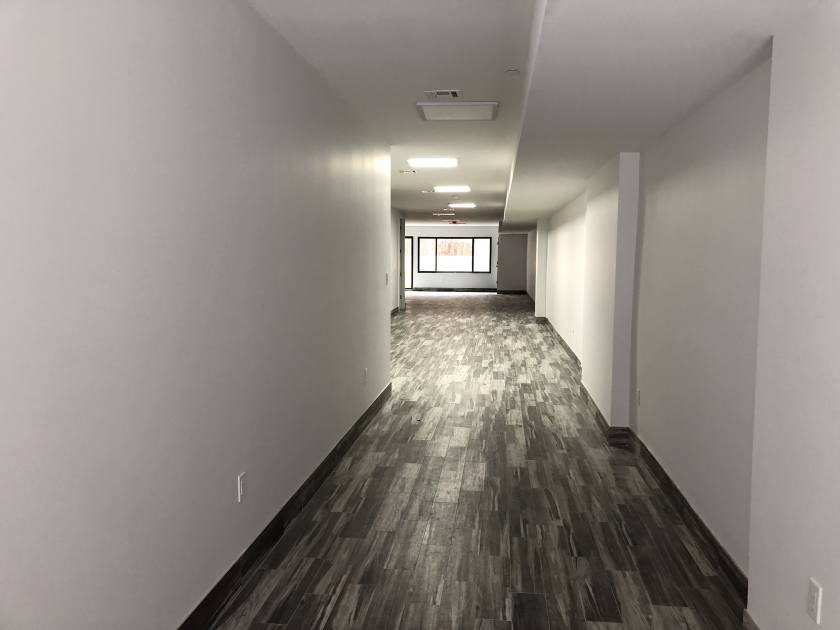
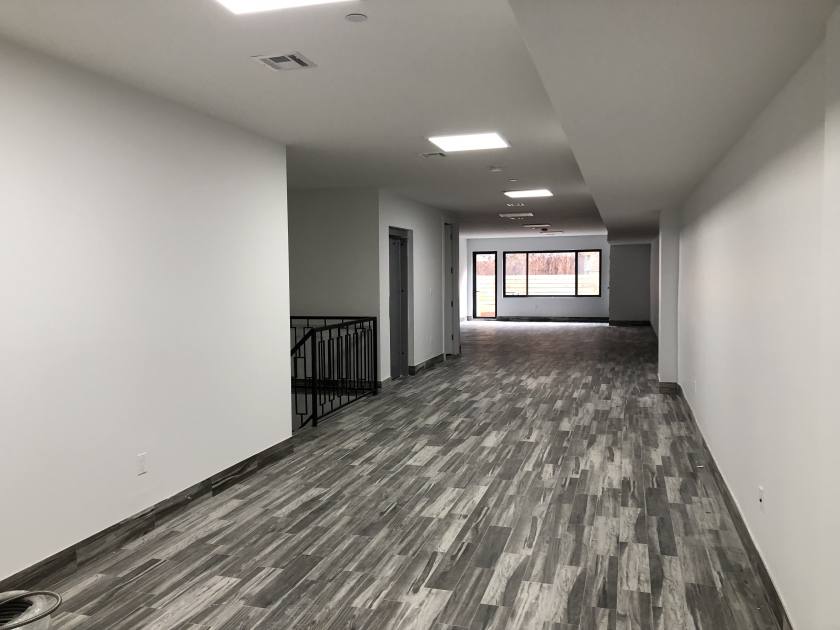
Additional Photos

Listing Agents

Shlomi Bagdadi
O: 718-437-6100
info@tristatecr.com
O: 718-437-6100
info@tristatecr.com
While we strive to provide the most accurate information, all listing information, and demographic data, is provided by third-parties. As such, MyEListing will not be responsible for the accuracy of the information. It is strongly recommended that you verify all information with the listing agent, and any relevant agencies, prior to making any decisions.