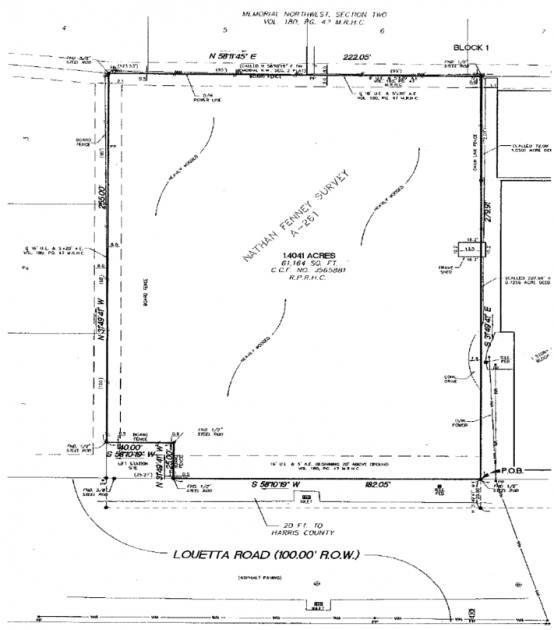
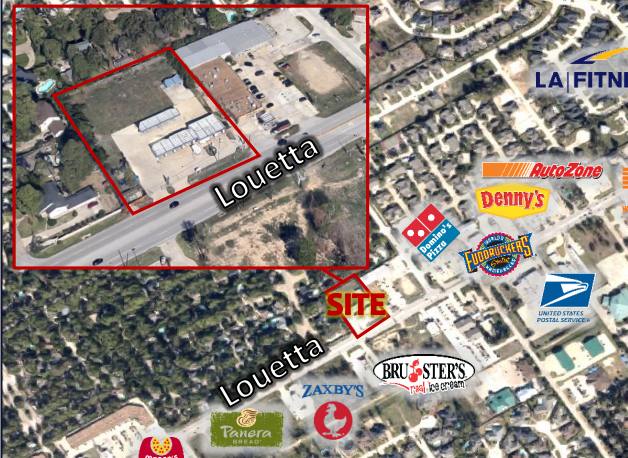
1-Mile | 3-Miles | 5-Miles | ||
---|---|---|---|---|
Total Population | 11,643 | 97,199 | 291,782 | |
Population Median Age | 40 | 38 | 36 | |
Population by Age | 0-9 Yrs | 1528 (13%) | 12906 (13%) | 43448 (14%) |
10-19 Yrs | 1732 (14%) | 13769 (14%) | 44135 (15%) | |
20-29 Yrs | 987 (8%) | 10496 (10%) | 34830 (11%) | |
30-39 Yrs | 1422 (12%) | 13569 (13%) | 44991 (15%) | |
40-49 Yrs | 1444 (12%) | 12717 (13%) | 39280 (13%) | |
50-59 Yrs | 1427 (12%) | 12868 (13%) | 34341 (11%) | |
60-69 Yrs | 1806 (15%) | 11762 (12%) | 28644 (9%) | |
70+ Yrs | 1298 (11%) | 9112 (9%) | 22114 (7%) | |
Median HH Income | $95,507 | $86,421 | $79,472 | |
Total Household Income | < 24K | 337 (8%) | 3537 (10%) | 10932 (10%) |
25-49K | 546 (13%) | 5975 (16%) | 18325 (18%) | |
50-74K | 644 (16%) | 6042 (17%) | 18166 (18%) | |
75-99K | 528 (13%) | 4597 (13%) | 13607 (13%) | |
100-199K | 1208 (30%) | 10025 (28%) | 27584 (27%) | |
200K+ | 658 (16%) | 5134 (14%) | 11101 (11%) | |
Highest Education Level | No Diploma | 387 | 3924 | 18432 |
Diploma or GED | 1587 | 11623 | 37278 | |
Some College | 1536 | 14189 | 41849 | |
Assoc. Degree | 668 | 5891 | 16195 | |
Bachelors Degree | 2271 | 19846 | 51818 | |
Higher Degree | 1396 | 9977 | 22693 | |
Total Housing Units | 4,249 | 37,738 | 106,259 | |
--Owner-Occupied | 2,939 | 23,917 | 64,811 | |
--Renter-Occupied | 982 | 11,393 | 34,905 | |
Owner-Occupied Values | < 100K | 30 | 1113 | 4045 |
100-199K | 738 | 6089 | 22546 | |
200-299K | 1068 | 8950 | 23197 | |
300-399K | 580 | 4407 | 8943 | |
400-499K | 254 | 1600 | 3196 | |
500K+ | 269 | 1758 | 2885 | |
Total Working Age Population | 8,879 | 76,169 | 221,036 | |
In Work Force | 5,606 | 50,118 | 152,022 | |
Not In Work Force | 3,273 | 26,051 | 69,014 | |
Workforce Employed | 5,247 | 46,810 | 142,716 | |
Workforce Unemployed | 350 | 3,247 | 9,176 | |
Civlian Workforce | 5,596 | 50,056 | 151,892 | |
Military Workforce | 10 | 62 | 130 | |
Total Households | 3,921 | 35,310 | 99,716 | |
Family Households | 3,260 | 25,722 | 73,862 | |
Non-Family Households | 661 | 9,588 | 25,854 | |
Married Couple | 2,540 | 20,224 | 55,073 | |
Other Family | 720 | 5,497 | 18,790 | |
Married w/Child | 920 | 8,502 | 25,296 | |
Single Male w/Child | 119 | 626 | 2,278 | |
Single Female w/Child | 282 | 1,769 | 8,218 |
Population Change Last Two Decades - Plus Projection
2000 | % | 2010 | % | 2020 | % | 2030 | |
---|---|---|---|---|---|---|---|
Texas | 20,851,820 | +21 | 25,145,561 | +18 | 29,677,668 | +18 | 34,894,452 |
Harris County | 3,400,578 | +20 | 4,092,459 | +22 | 4,978,845 | +19 | 5,924,750 |
Total Working Age Population:
Total Households:
Total Working Age Population:
Total Households:
Total Working Age Population:
Total Households: