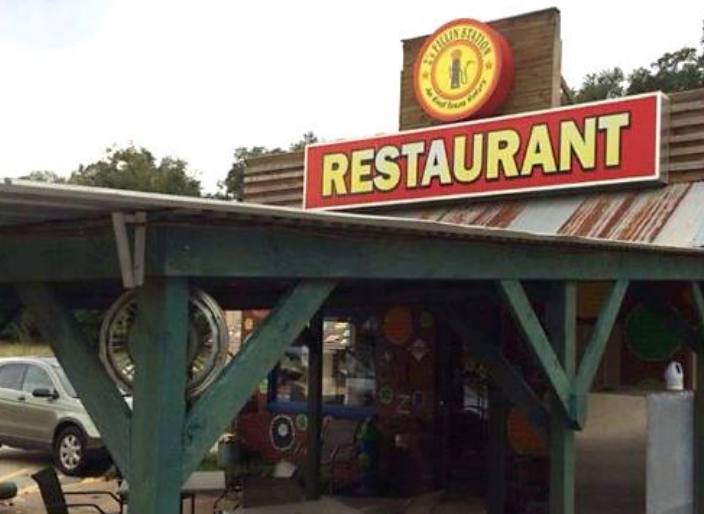
Retail Space
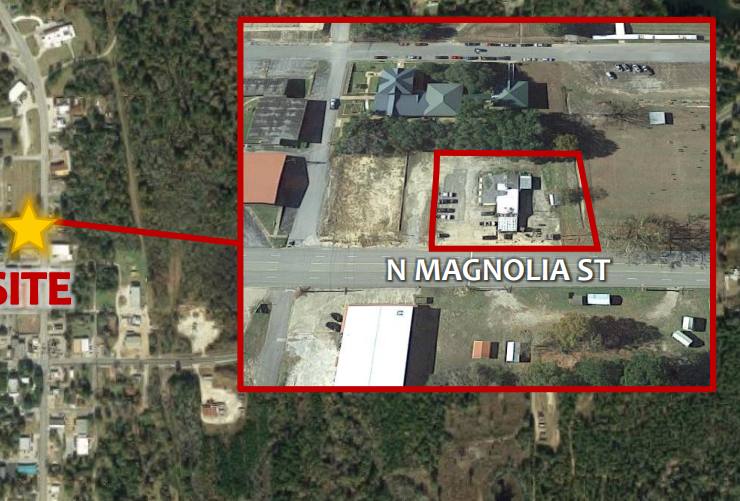
307 North Magnolia Street Woodville, TX 75979
307 North Magnolia Street Woodville, TX 75979
Details & Description
Property Highlights
- • Monument Signage
- • Established in 2003
- • Naskilla also offers a full service RV campground
- • Family Owned & Operated
- • Seller Financing Available
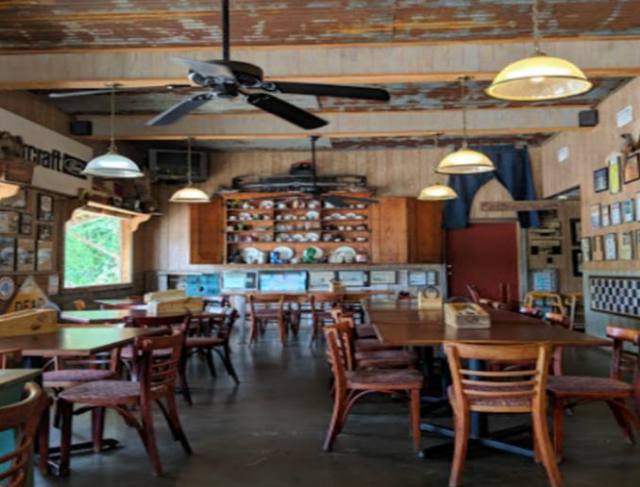
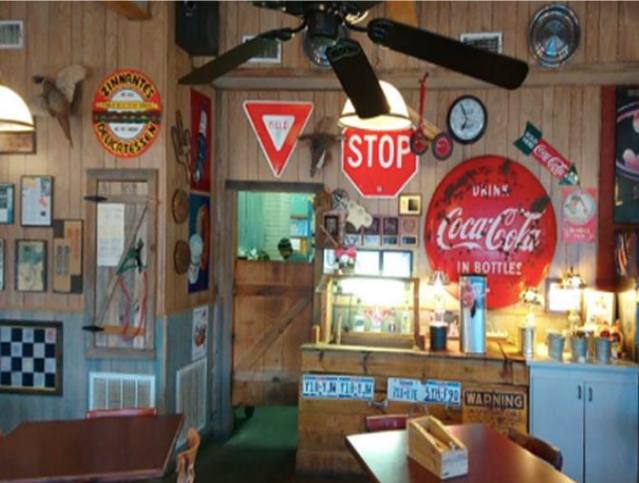
Additional Photos
Listing Agents

Nick Childs
O: 281-210-3090
M: 281-210-2487
nick@newcorcre.com
O: 281-210-3090
M: 281-210-2487
nick@newcorcre.com

Robert Banzhaf
O: 281-210-3090
M: 281-210-0093
rob@newcorcre.com
O: 281-210-3090
M: 281-210-0093
rob@newcorcre.com
While we strive to provide the most accurate information, all listing information, and demographic data, is provided by third-parties. As such, MyEListing will not be responsible for the accuracy of the information. It is strongly recommended that you verify all information with the listing agent, and any relevant agencies, prior to making any decisions.


