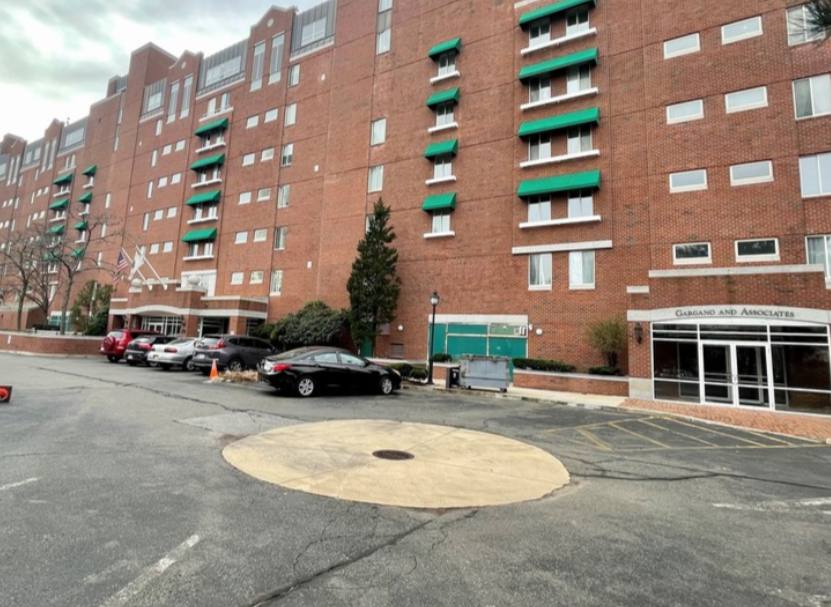
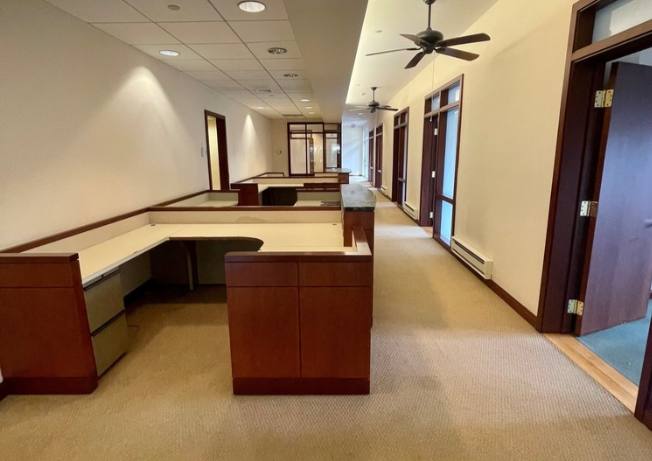
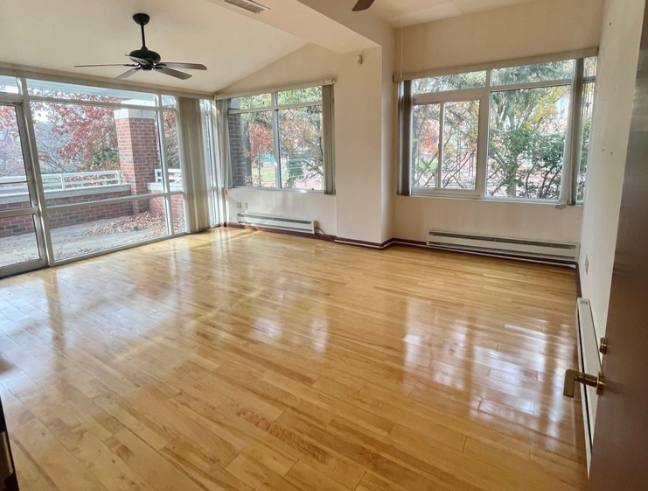
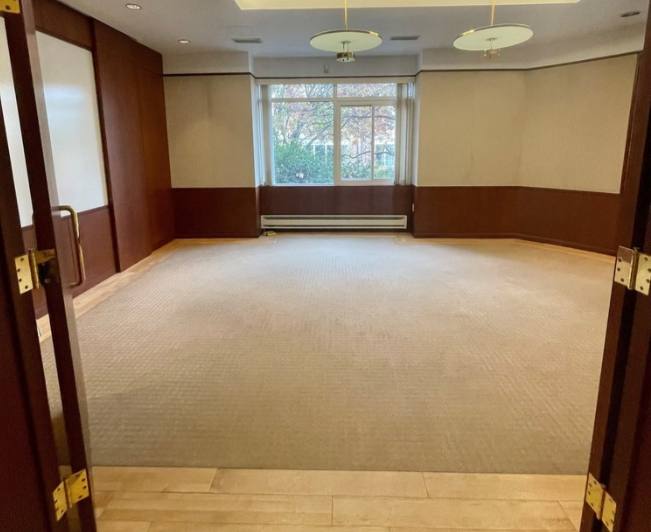
1-Mile | 3-Miles | 5-Miles | ||
---|---|---|---|---|
Total Population | 52,983 | 475,229 | 1,002,087 | |
Population Median Age | 37 | 35 | 36 | |
Population by Age | 0-9 Yrs | 4557 (8%) | 36712 (7%) | 88089 (8%) |
10-19 Yrs | 2559 (4%) | 52934 (11%) | 104047 (10%) | |
20-29 Yrs | 13952 (26%) | 135734 (28%) | 251620 (25%) | |
30-39 Yrs | 13063 (24%) | 92983 (19%) | 185946 (18%) | |
40-49 Yrs | 5508 (10%) | 47409 (9%) | 108030 (10%) | |
50-59 Yrs | 4744 (8%) | 42015 (8%) | 101807 (10%) | |
60-69 Yrs | 4309 (8%) | 35113 (7%) | 83459 (8%) | |
70+ Yrs | 4290 (8%) | 32329 (6%) | 79089 (7%) | |
Median HH Income | $113,352 | $89,270 | $84,391 | |
Total Household Income | < 24K | 3683 (14%) | 38658 (19%) | 80533 (19%) |
25-49K | 2390 (9%) | 24404 (12%) | 54472 (13%) | |
50-74K | 2951 (11%) | 23177 (11%) | 50679 (12%) | |
75-99K | 2650 (10%) | 20874 (10%) | 44180 (10%) | |
100-199K | 8235 (31%) | 52608 (26%) | 111292 (27%) | |
200K+ | 6155 (23%) | 36590 (18%) | 63408 (15%) | |
Highest Education Level | No Diploma | 2163 | 35963 | 77401 |
Diploma or GED | 3478 | 43085 | 124743 | |
Some College | 2702 | 28378 | 77612 | |
Assoc. Degree | 1155 | 9976 | 26870 | |
Bachelors Degree | 15134 | 100997 | 198653 | |
Higher Degree | 16490 | 106336 | 196974 | |
Total Housing Units | 29,487 | 217,741 | 439,624 | |
--Owner-Occupied | 8,812 | 59,779 | 143,166 | |
--Renter-Occupied | 17,252 | 136,531 | 261,398 | |
Owner-Occupied Values | < 100K | 65 | 1000 | 2930 |
100-199K | 113 | 736 | 2190 | |
200-299K | 130 | 2530 | 8013 | |
300-399K | 484 | 4497 | 16556 | |
400-499K | 606 | 5204 | 18692 | |
500K+ | 7414 | 45812 | 94785 | |
Total Working Age Population | 47,113 | 421,772 | 867,414 | |
In Work Force | 35,217 | 297,891 | 615,608 | |
Not In Work Force | 11,896 | 123,880 | 251,806 | |
Workforce Employed | 34,093 | 280,895 | 580,705 | |
Workforce Unemployed | 1,022 | 16,438 | 34,111 | |
Civlian Workforce | 35,115 | 297,334 | 614,816 | |
Military Workforce | 102 | 558 | 792 | |
Total Households | 26,064 | 196,311 | 404,563 | |
Family Households | 9,552 | 79,283 | 188,374 | |
Non-Family Households | 16,512 | 117,028 | 216,190 | |
Married Couple | 7,502 | 55,547 | 127,289 | |
Other Family | 2,051 | 23,736 | 61,085 | |
Married w/Child | 2,608 | 19,196 | 47,386 | |
Single Male w/Child | 163 | 2,108 | 5,352 | |
Single Female w/Child | 667 | 8,746 | 21,786 |
Population Change Last Two Decades - Plus Projection
2000 | % | 2010 | % | 2020 | % | 2030 | |
---|---|---|---|---|---|---|---|
Massachusetts | 6,349,097 | +3 | 6,547,629 | +6 | 6,933,887 | +4 | 7,225,472 |
Norfolk County | 650,308 | +3 | 670,850 | +7 | 718,394 | +7 | 765,912 |
Suffolk County | 689,807 | +5 | 722,023 | +14 | 821,840 | +10 | 900,586 |
Middlesex County | 1,465,396 | +3 | 1,503,085 | +7 | 1,613,961 | +5 | 1,686,641 |
Total Working Age Population:
Total Households:
Total Working Age Population:
Total Households:
Total Working Age Population:
Total Households: