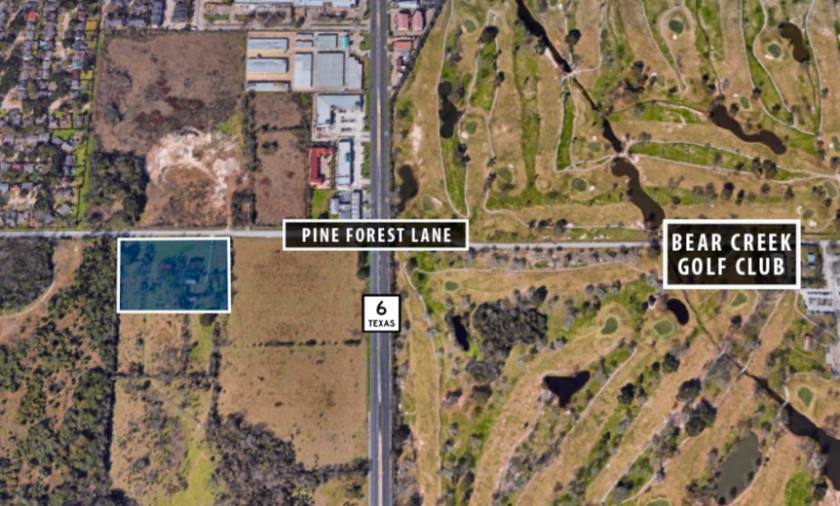
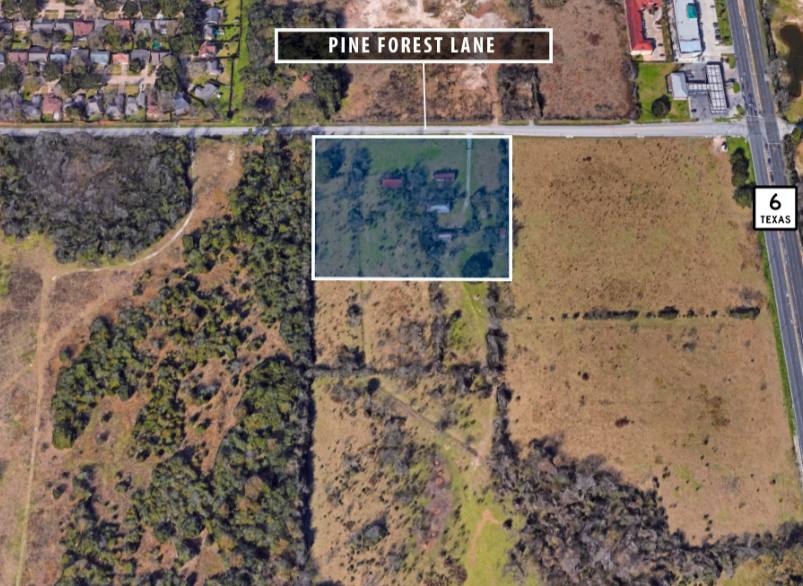
1-Mile | 3-Miles | 5-Miles | ||
---|---|---|---|---|
Total Population | 6,489 | 76,263 | 256,523 | |
Population Median Age | 34 | 34 | 35 | |
Population by Age | 0-9 Yrs | 1229 (18%) | 11776 (15%) | 36946 (14%) |
10-19 Yrs | 816 (12%) | 11816 (15%) | 40479 (15%) | |
20-29 Yrs | 1035 (15%) | 11550 (15%) | 32533 (12%) | |
30-39 Yrs | 1136 (17%) | 10999 (14%) | 38479 (15%) | |
40-49 Yrs | 587 (9%) | 9314 (12%) | 36088 (14%) | |
50-59 Yrs | 502 (7%) | 9436 (12%) | 32442 (12%) | |
60-69 Yrs | 754 (11%) | 7323 (9%) | 25008 (9%) | |
70+ Yrs | 430 (6%) | 4050 (5%) | 14547 (5%) | |
Median HH Income | $50,295 | $72,910 | $74,839 | |
Total Household Income | < 24K | 443 (23%) | 3012 (12%) | 8404 (9%) |
25-49K | 502 (26%) | 5046 (20%) | 16961 (19%) | |
50-74K | 222 (11%) | 4304 (17%) | 17257 (20%) | |
75-99K | 352 (18%) | 4040 (16%) | 12873 (15%) | |
100-199K | 323 (17%) | 6234 (25%) | 22538 (26%) | |
200K+ | 52 (2%) | 1426 (5%) | 6994 (8%) | |
Highest Education Level | No Diploma | 1065 | 8056 | 23665 |
Diploma or GED | 943 | 9999 | 32975 | |
Some College | 712 | 9354 | 34223 | |
Assoc. Degree | 282 | 4094 | 14658 | |
Bachelors Degree | 580 | 10578 | 39467 | |
Higher Degree | 153 | 4560 | 18278 | |
Total Housing Units | 2,342 | 26,120 | 92,066 | |
--Owner-Occupied | 1,088 | 16,506 | 55,048 | |
--Renter-Occupied | 805 | 7,557 | 29,978 | |
Owner-Occupied Values | < 100K | 62 | 1092 | 3521 |
100-199K | 842 | 9622 | 28679 | |
200-299K | 99 | 4517 | 14643 | |
300-399K | 31 | 624 | 3217 | |
400-499K | 40 | 416 | 2391 | |
500K+ | 14 | 236 | 2597 | |
Total Working Age Population | 4,712 | 57,296 | 193,271 | |
In Work Force | 2,989 | 39,837 | 135,399 | |
Not In Work Force | 1,723 | 17,459 | 57,872 | |
Workforce Employed | 2,841 | 37,688 | 128,118 | |
Workforce Unemployed | 148 | 2,149 | 7,264 | |
Civlian Workforce | 2,989 | 39,837 | 135,382 | |
Military Workforce | 0 | 0 | 16 | |
Total Households | 1,893 | 24,064 | 85,027 | |
Family Households | 1,479 | 18,498 | 65,004 | |
Non-Family Households | 415 | 5,565 | 20,023 | |
Married Couple | 1,060 | 13,220 | 47,308 | |
Other Family | 419 | 5,278 | 17,696 | |
Married w/Child | 514 | 6,180 | 23,176 | |
Single Male w/Child | 11 | 424 | 1,733 | |
Single Female w/Child | 258 | 2,188 | 7,496 |
Population Change Last Two Decades - Plus Projection
2000 | % | 2010 | % | 2020 | % | 2030 | |
---|---|---|---|---|---|---|---|
Texas | 20,851,820 | +21 | 25,145,561 | +18 | 29,677,668 | +18 | 34,894,452 |
Harris County | 3,400,578 | +20 | 4,092,459 | +22 | 4,978,845 | +19 | 5,924,750 |
Total Working Age Population:
Total Households:
Total Working Age Population:
Total Households:
Total Working Age Population:
Total Households: