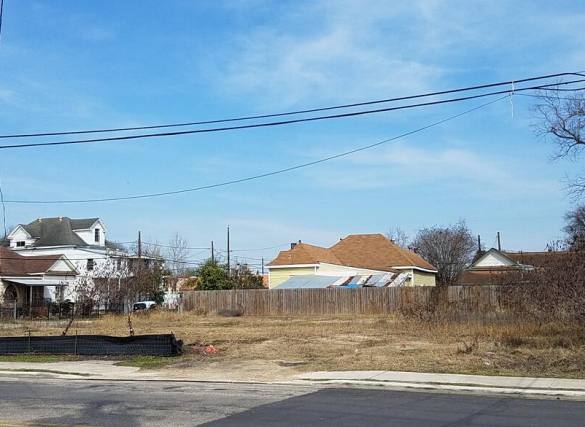
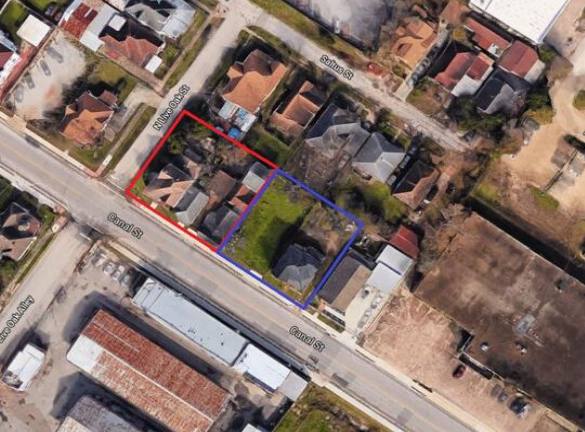
Commercial Land
2601 and 2603 Canal St Houston, TX 77003
2601 and 2603 Canal St Houston, TX 77003
Details & Description
Property Highlights
- • 100 ft. of frontage on Canal St
- • 100 ft. of frontage on Live Oak St
- • Curb cut on Canal St
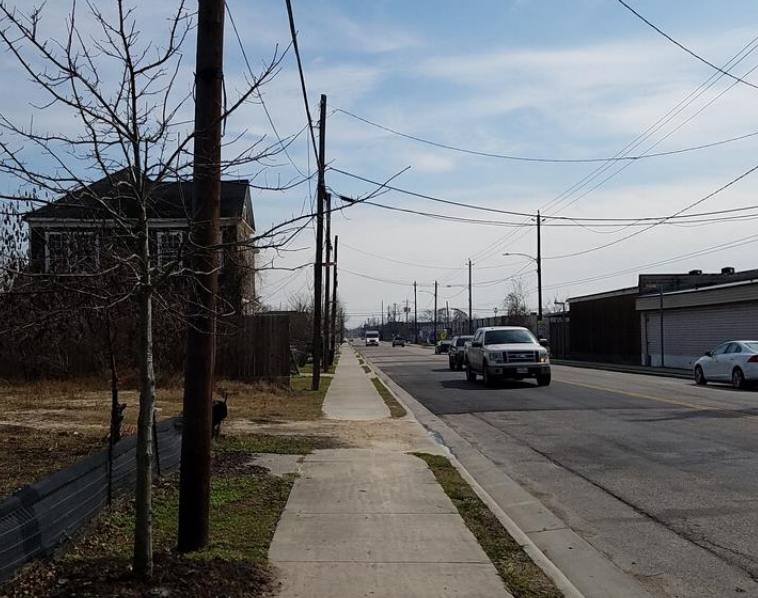
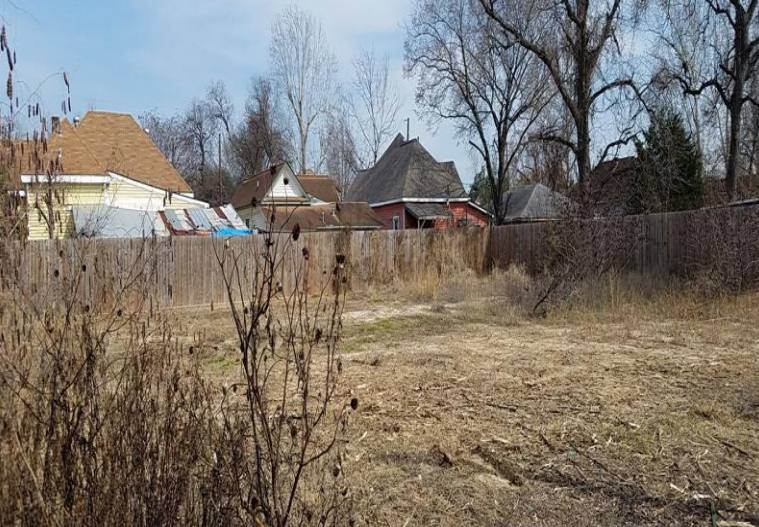
Additional Photos
Listing Agents

Bill Wong
O: 713-961-9097
billw@orangecommercial.com
O: 713-961-9097
billw@orangecommercial.com
While we strive to provide the most accurate information, all listing information, and demographic data, is provided by third-parties. As such, MyEListing will not be responsible for the accuracy of the information. It is strongly recommended that you verify all information with the listing agent, and any relevant agencies, prior to making any decisions.


