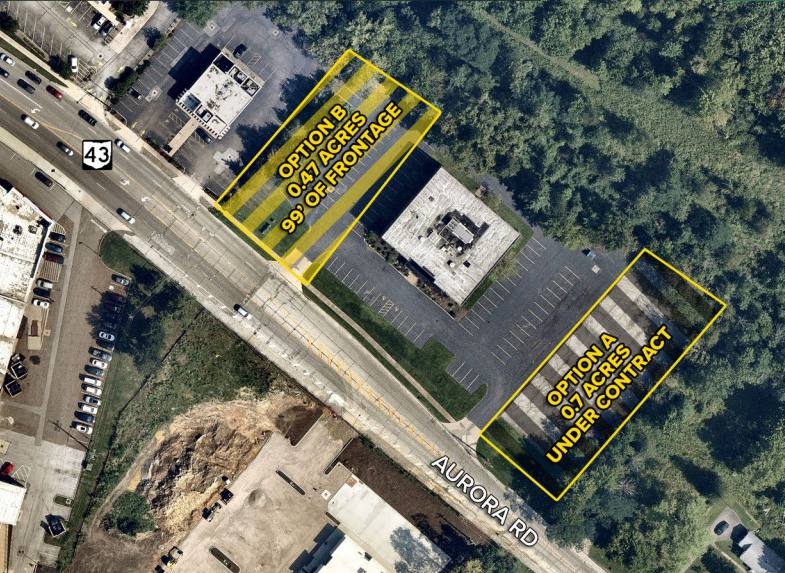
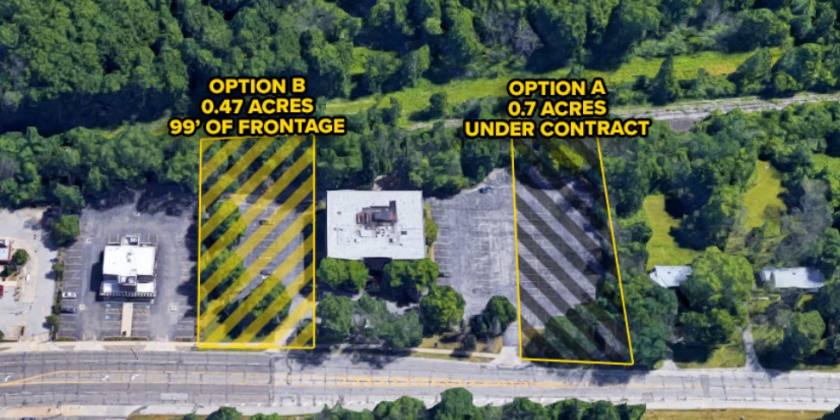
Commercial Land
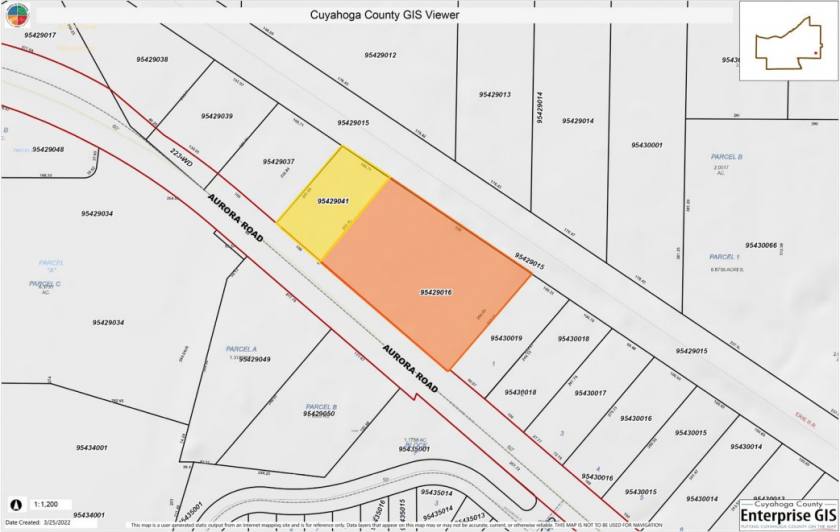
34501 Aurora Road Solon, OH 44139
34501 Aurora Road Solon, OH 44139
Details & Description
Property Highlights
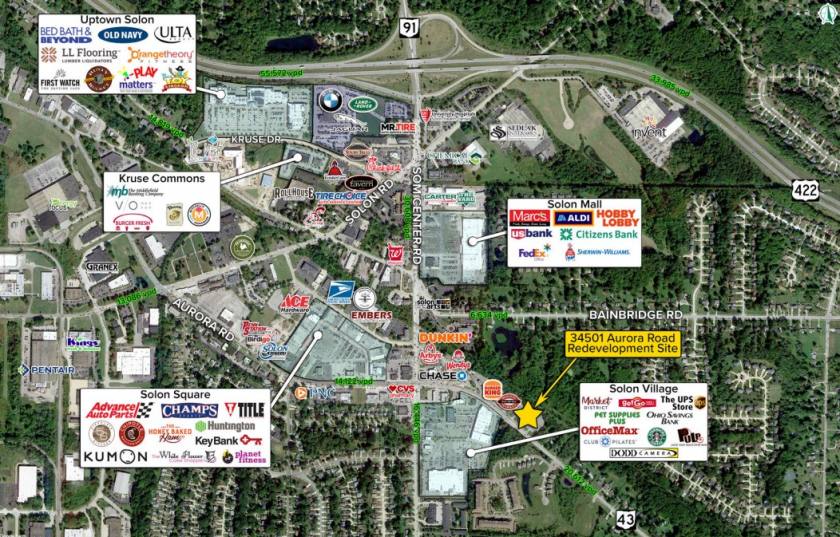
• Solon is an affluent east side Cleveland suburb and draws from Orange, Chagrin Falls, Bainbridge, Aurora, and Twinsburg
• Minutes from US 422, with quick access to I-271 and I-480
Additional Photos
Listing Agents

Tori Nook
O: 216-342-2550
M: 216-269-5624
tnook@anchorretail.com
O: 216-342-2550
M: 216-269-5624
tnook@anchorretail.com

Chris McFarland
O: 216-342-2578
M: 216-338-3054
cmcfarland@anchorretail.com
O: 216-342-2578
M: 216-338-3054
cmcfarland@anchorretail.com
While we strive to provide the most accurate information, all listing information, and demographic data, is provided by third-parties. As such, MyEListing will not be responsible for the accuracy of the information. It is strongly recommended that you verify all information with the listing agent, and any relevant agencies, prior to making any decisions.


