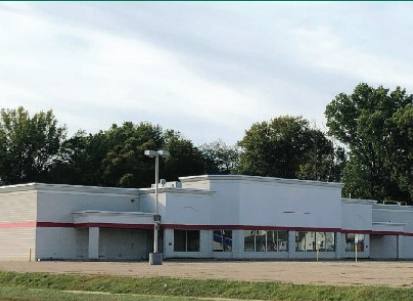
Retail Space
832 West Main Street Ravenna, OH 44266
832 West Main Street Ravenna, OH 44266
Details & Description
Property Highlights
- • On 4.2 acres
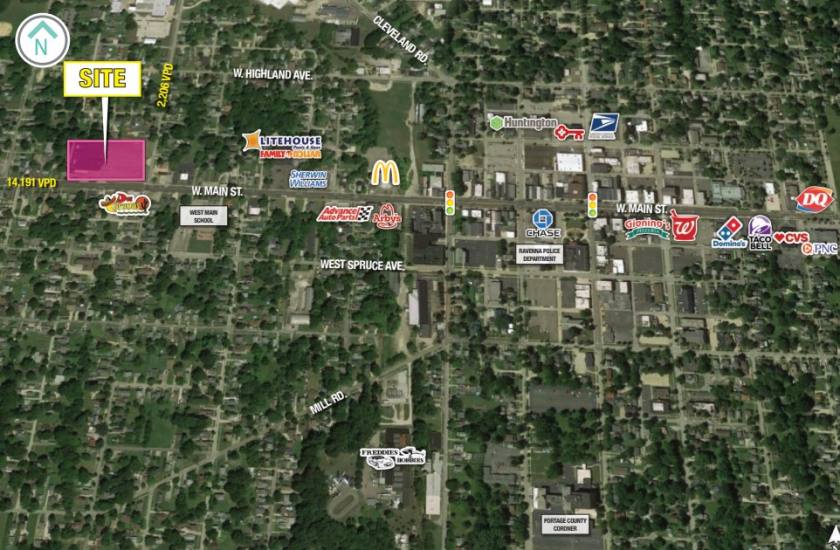
- • Located in the heart of the Ravenna trade area
- • Parcel Number: 31-306-03-00-021-000
- • Located at a signalized intersection
- • Zoned C-1 local commercial district
Listing Agents

Greg Guyuron
O: 216-342-2564
M: 440-821-4770
gguyuron@anchorretail.com
O: 216-342-2564
M: 440-821-4770
gguyuron@anchorretail.com

Allison Giomuso
O: 216-342-2620
M: 440-364-5626
agiomuso@anchorretail.com
O: 216-342-2620
M: 440-364-5626
agiomuso@anchorretail.com
While we strive to provide the most accurate information, all listing information, and demographic data, is provided by third-parties. As such, MyEListing will not be responsible for the accuracy of the information. It is strongly recommended that you verify all information with the listing agent, and any relevant agencies, prior to making any decisions.