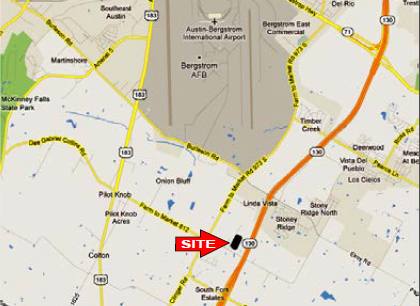
1-Mile | 3-Miles | 5-Miles | ||
---|---|---|---|---|
Total Population | 1,789 | 11,916 | 38,684 | |
Population Median Age | 37 | 34 | 34 | |
Population by Age | 0-9 Yrs | 126 (7%) | 1525 (12%) | 4869 (12%) |
10-19 Yrs | 256 (14%) | 1917 (16%) | 6037 (15%) | |
20-29 Yrs | 264 (14%) | 1585 (13%) | 5505 (14%) | |
30-39 Yrs | 319 (17%) | 2269 (19%) | 7262 (18%) | |
40-49 Yrs | 457 (25%) | 2095 (17%) | 6625 (17%) | |
50-59 Yrs | 111 (6%) | 1105 (9%) | 4077 (10%) | |
60-69 Yrs | 204 (11%) | 1110 (9%) | 2986 (7%) | |
70+ Yrs | 53 (2%) | 309 (2%) | 1323 (3%) | |
Median HH Income | $58,505 | $73,151 | $80,080 | |
Total Household Income | < 24K | 30 (5%) | 231 (6%) | 794 (7%) |
25-49K | 216 (36%) | 896 (27%) | 2322 (21%) | |
50-74K | 120 (20%) | 570 (17%) | 1933 (17%) | |
75-99K | 26 (4%) | 333 (10%) | 1611 (14%) | |
100-199K | 197 (33%) | 1099 (33%) | 3460 (32%) | |
200K+ | 1 (0%) | 175 (5%) | 633 (5%) | |
Highest Education Level | No Diploma | 478 | 2166 | 5598 |
Diploma or GED | 222 | 2062 | 7617 | |
Some College | 104 | 1284 | 5404 | |
Assoc. Degree | 65 | 498 | 1334 | |
Bachelors Degree | 285 | 1229 | 4044 | |
Higher Degree | 81 | 332 | 1344 | |
Total Housing Units | 644 | 3,568 | 11,352 | |
--Owner-Occupied | 525 | 2,798 | 8,940 | |
--Renter-Occupied | 65 | 505 | 1,813 | |
Owner-Occupied Values | < 100K | 22 | 318 | 1117 |
100-199K | 311 | 1404 | 2900 | |
200-299K | 84 | 705 | 3877 | |
300-399K | 106 | 306 | 818 | |
400-499K | 0 | 20 | 91 | |
500K+ | 1 | 45 | 138 | |
Total Working Age Population | 1,440 | 9,020 | 29,852 | |
In Work Force | 1,114 | 7,183 | 21,295 | |
Not In Work Force | 326 | 1,837 | 8,557 | |
Workforce Employed | 1,102 | 6,982 | 20,285 | |
Workforce Unemployed | 12 | 160 | 946 | |
Civlian Workforce | 1,114 | 7,142 | 21,231 | |
Military Workforce | 0 | 42 | 64 | |
Total Households | 590 | 3,303 | 10,753 | |
Family Households | 381 | 2,528 | 8,479 | |
Non-Family Households | 209 | 775 | 2,274 | |
Married Couple | 277 | 1,669 | 5,934 | |
Other Family | 103 | 859 | 2,545 | |
Married w/Child | 115 | 719 | 2,941 | |
Single Male w/Child | 24 | 131 | 256 | |
Single Female w/Child | 37 | 337 | 827 |
Population Change Last Two Decades - Plus Projection
2000 | % | 2010 | % | 2020 | % | 2030 | |
---|---|---|---|---|---|---|---|
Texas | 20,851,820 | +21 | 25,145,561 | +18 | 29,677,668 | +18 | 34,894,452 |
Bastrop County | 57,733 | +28 | 74,171 | +16 | 86,105 | +15 | 99,211 |
Travis County | 812,280 | +26 | 1,024,266 | +26 | 1,291,502 | +19 | 1,540,812 |
Total Working Age Population:
Total Households:
Total Working Age Population:
Total Households:
Total Working Age Population:
Total Households: