Retail Space
9559-9599 Mentor Ave Mentor, OH 44060
9559-9599 Mentor Ave Mentor, OH 44060
Details & Description
Property Highlights
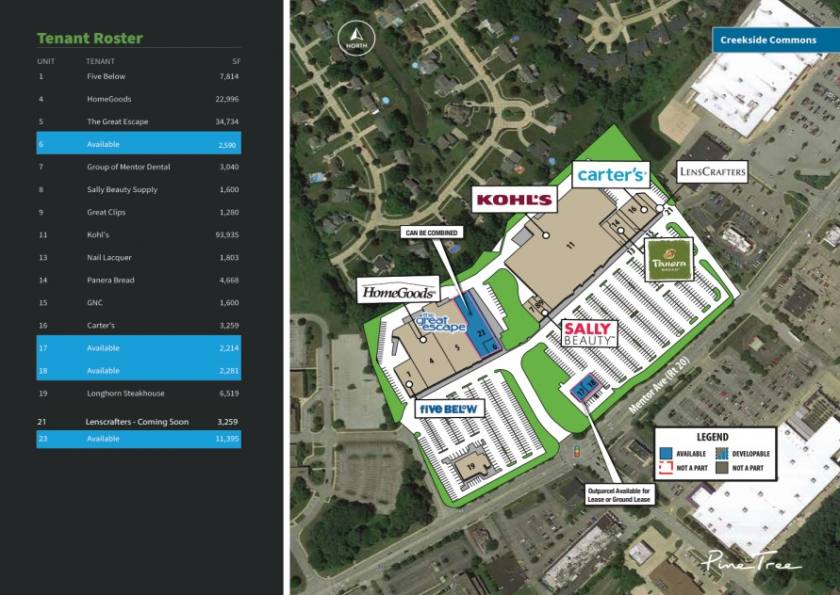
- • 13,985 SF Junior Anchor space
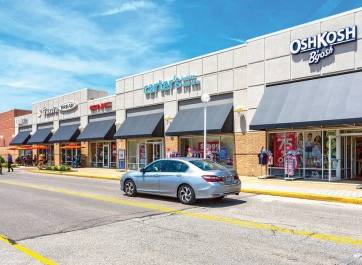
- • Attractive plaza with best of class anchor tenants
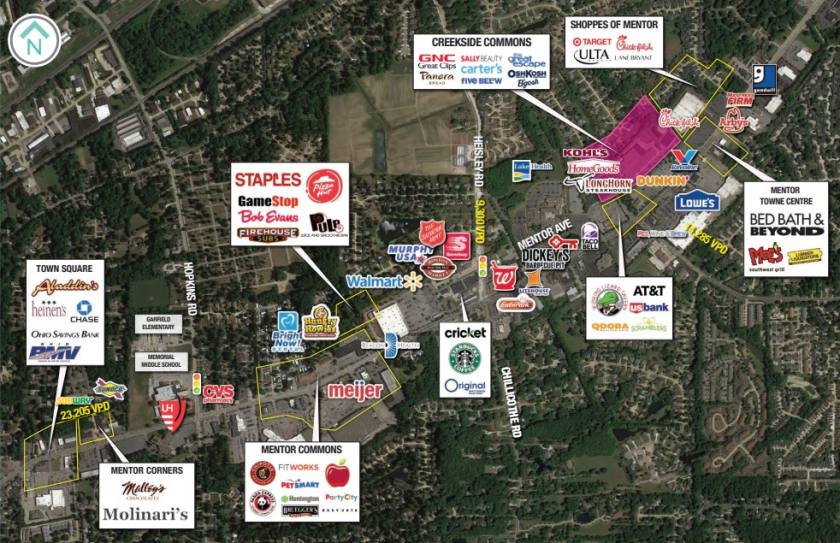
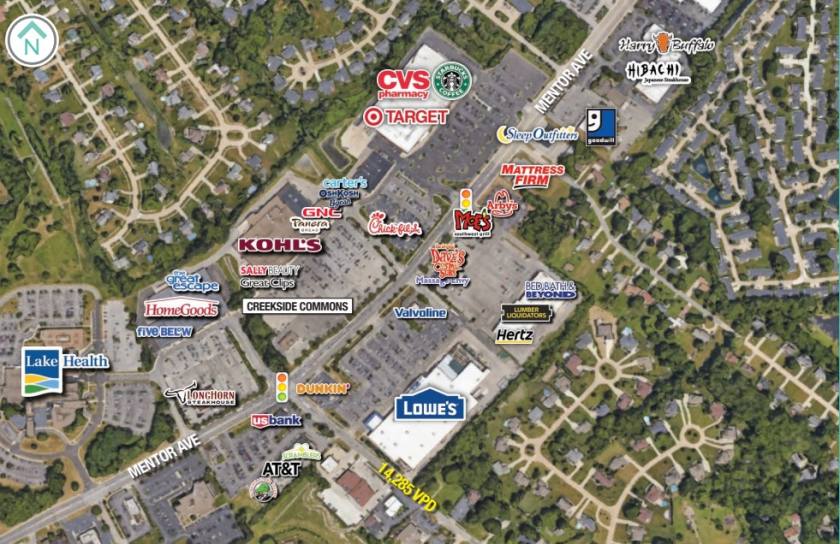
- • Located next to Target and Ulta
Additional Photos
Listing Agents

Matt Wilson
M: 216-470-8200
mwilson@anchorretail.com
M: 216-470-8200
mwilson@anchorretail.com

Greg Guyuron
O: 216-342-2564
M: 440-821-4770
gguyuron@anchorretail.com
O: 216-342-2564
M: 440-821-4770
gguyuron@anchorretail.com
While we strive to provide the most accurate information, all listing information, and demographic data, is provided by third-parties. As such, MyEListing will not be responsible for the accuracy of the information. It is strongly recommended that you verify all information with the listing agent, and any relevant agencies, prior to making any decisions.


