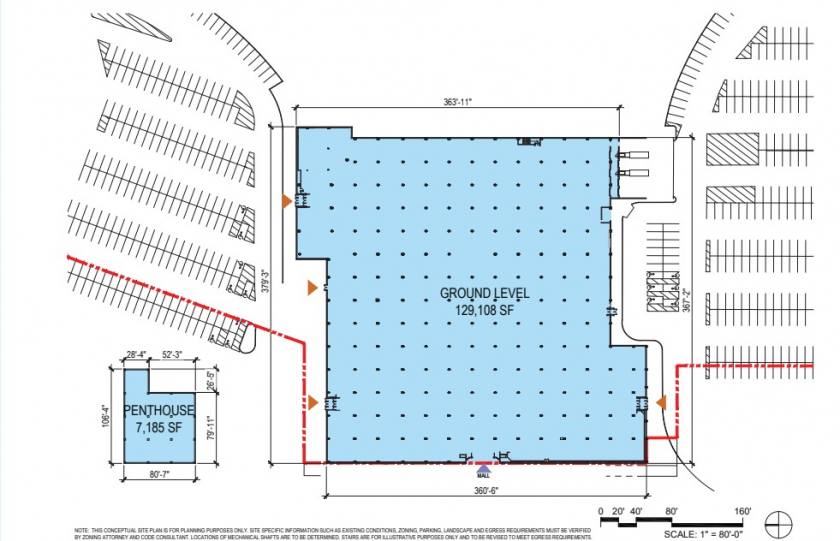
Retail Space
2700 Miamisburg Centerville Road Dayton, OH 45459
2700 Miamisburg Centerville Road Dayton, OH 45459
Details & Description
Property Highlights
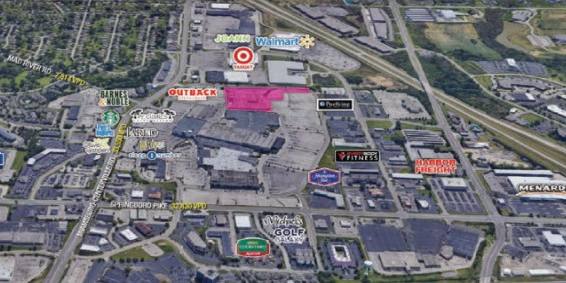
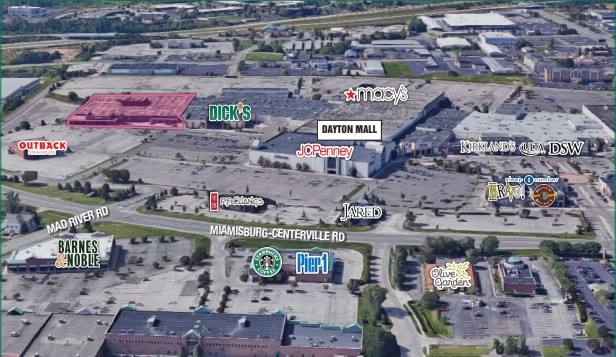
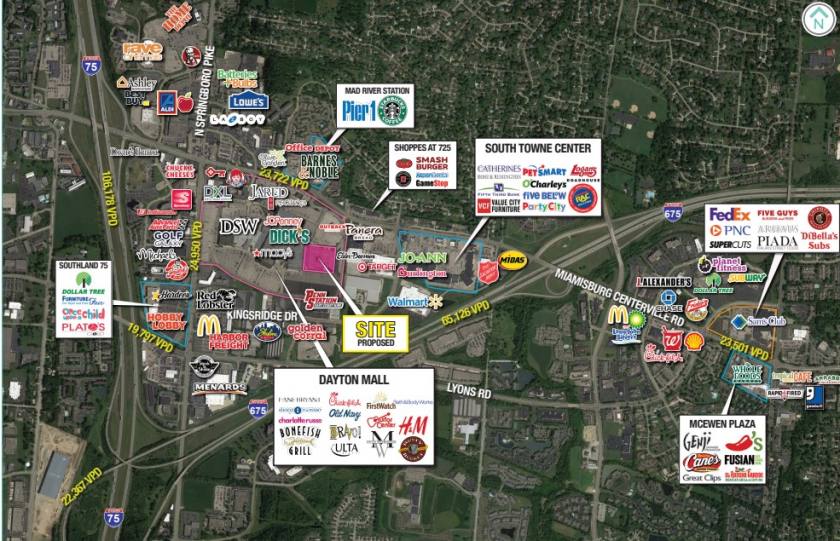
• Affluent population with average household incomes over 90k in surrounding 5 mile area
• Dayton Mall has 92% occupancy
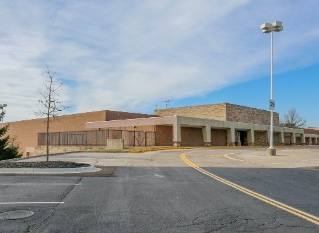
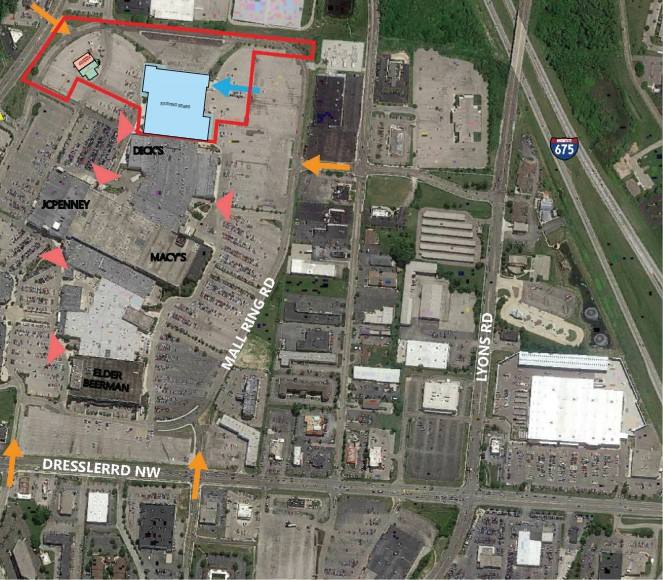
Additional Photos
Listing Agents

Tori Nook
O: 216-342-2550
M: 216-269-5624
tnook@anchorretail.com
O: 216-342-2550
M: 216-269-5624
tnook@anchorretail.com

Matt Wilson
M: 216-470-8200
mwilson@anchorretail.com
M: 216-470-8200
mwilson@anchorretail.com

Ben McMillon
O: 216-342-2607
M: 440-725-6551
ben@blmcmillon.com
O: 216-342-2607
M: 440-725-6551
ben@blmcmillon.com
While we strive to provide the most accurate information, all listing information, and demographic data, is provided by third-parties. As such, MyEListing will not be responsible for the accuracy of the information. It is strongly recommended that you verify all information with the listing agent, and any relevant agencies, prior to making any decisions.