Retail Space
29001 Cedar Road Lyndhurst, OH 44124
29001 Cedar Road Lyndhurst, OH 44124
Details & Description
Property Highlights
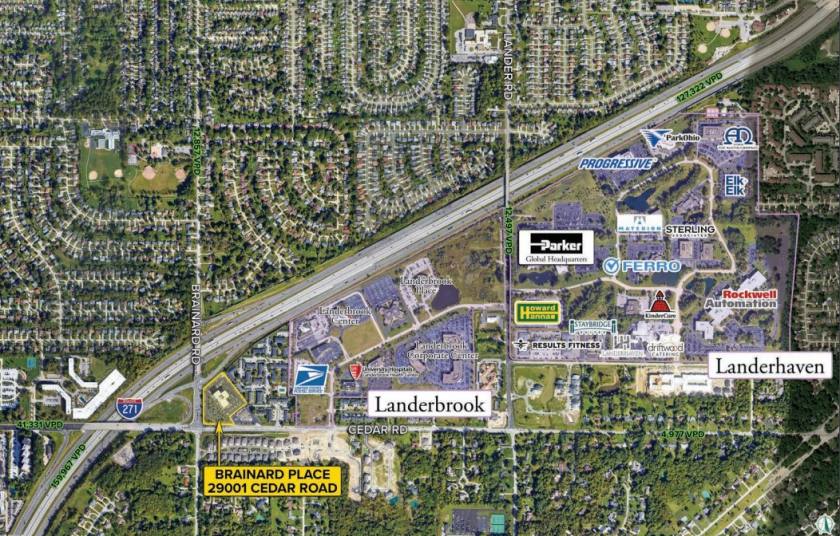
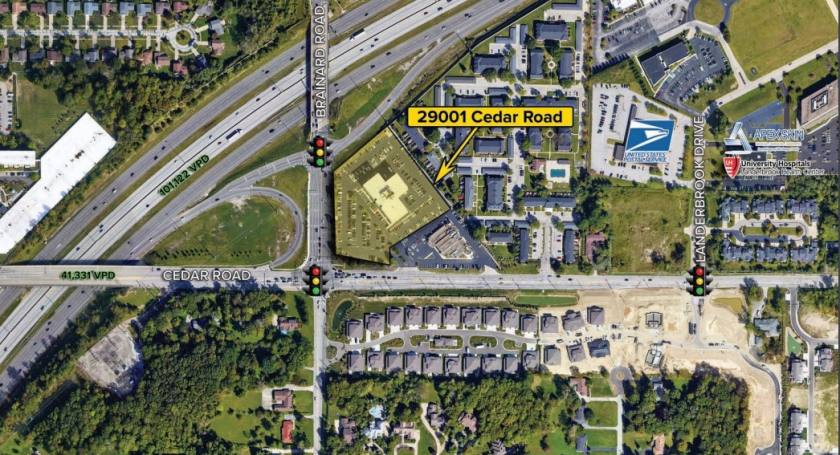
• Corner space with visibility from one of Cleveland’s busiest intersections – 39,790 VPD
• Directly off the I-271 interchange – 101,122 VPD
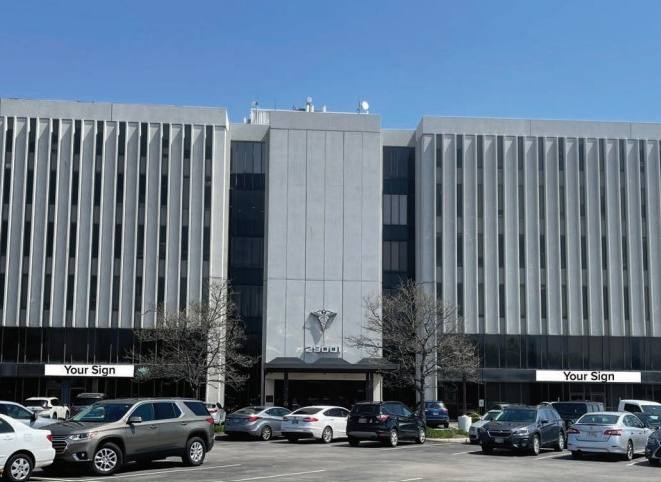
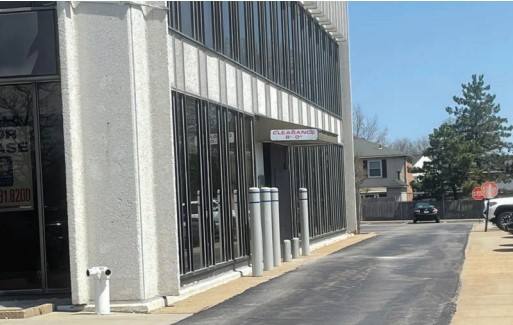
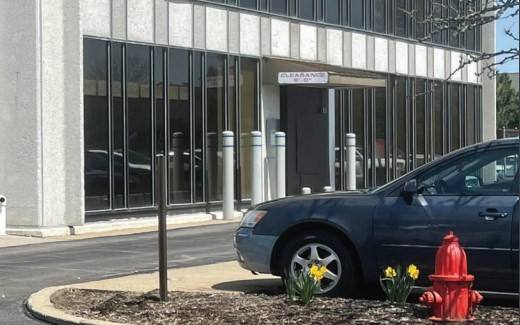
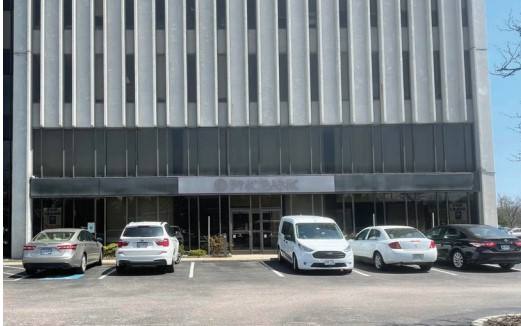
Additional Photos
Listing Agents

Greg Guyuron
O: 216-342-2564
M: 440-821-4770
gguyuron@anchorretail.com
O: 216-342-2564
M: 440-821-4770
gguyuron@anchorretail.com
While we strive to provide the most accurate information, all listing information, and demographic data, is provided by third-parties. As such, MyEListing will not be responsible for the accuracy of the information. It is strongly recommended that you verify all information with the listing agent, and any relevant agencies, prior to making any decisions.