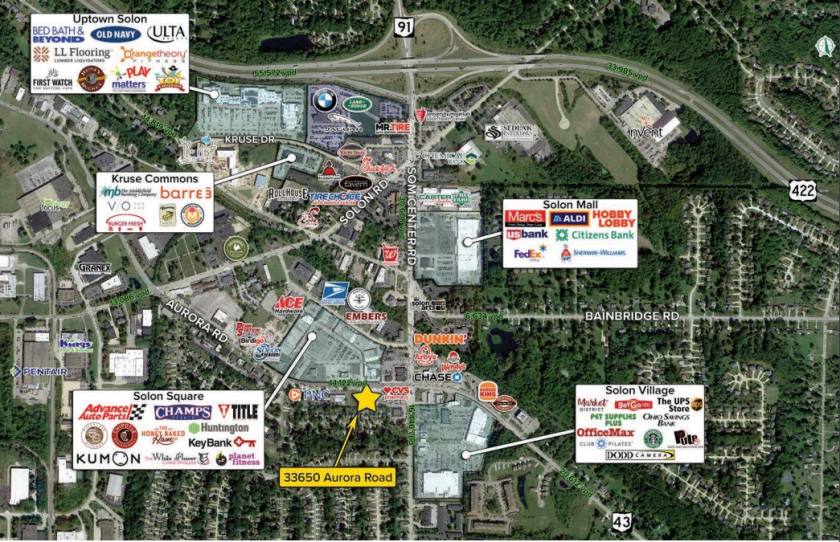
1-Mile | 3-Miles | 5-Miles | ||
---|---|---|---|---|
Total Population | 4,543 | 28,688 | 91,716 | |
Population Median Age | 41 | 41 | 42 | |
Population by Age | 0-9 Yrs | 610 (13%) | 3365 (11%) | 10210 (11%) |
10-19 Yrs | 609 (13%) | 4127 (14%) | 12231 (13%) | |
20-29 Yrs | 238 (5%) | 2008 (6%) | 7970 (8%) | |
30-39 Yrs | 536 (11%) | 2924 (10%) | 10770 (11%) | |
40-49 Yrs | 681 (14%) | 4535 (15%) | 11780 (12%) | |
50-59 Yrs | 737 (16%) | 4220 (14%) | 13585 (14%) | |
60-69 Yrs | 491 (10%) | 4040 (14%) | 13543 (14%) | |
70+ Yrs | 641 (14%) | 3468 (12%) | 11626 (12%) | |
Median HH Income | $71,928 | $113,134 | $77,294 | |
Total Household Income | < 24K | 223 (12%) | 918 (8%) | 5574 (14%) |
25-49K | 360 (19%) | 1253 (11%) | 6795 (17%) | |
50-74K | 368 (20%) | 1347 (12%) | 6162 (16%) | |
75-99K | 213 (11%) | 1153 (10%) | 4794 (12%) | |
100-199K | 461 (25%) | 3543 (33%) | 9350 (24%) | |
200K+ | 180 (9%) | 2468 (23%) | 5267 (13%) | |
Highest Education Level | No Diploma | 208 | 876 | 3031 |
Diploma or GED | 576 | 3104 | 14573 | |
Some College | 465 | 2710 | 12175 | |
Assoc. Degree | 224 | 1139 | 5077 | |
Bachelors Degree | 890 | 6360 | 16868 | |
Higher Degree | 832 | 5865 | 13330 | |
Total Housing Units | 1,930 | 11,217 | 40,226 | |
--Owner-Occupied | 1,293 | 9,207 | 27,518 | |
--Renter-Occupied | 512 | 1,475 | 10,423 | |
Owner-Occupied Values | < 100K | 68 | 389 | 3490 |
100-199K | 506 | 1473 | 7733 | |
200-299K | 484 | 3049 | 6928 | |
300-399K | 61 | 1513 | 3769 | |
400-499K | 84 | 1240 | 2373 | |
500K+ | 89 | 1543 | 3226 | |
Total Working Age Population | 3,524 | 22,538 | 73,937 | |
In Work Force | 2,469 | 15,210 | 48,325 | |
Not In Work Force | 1,056 | 7,327 | 25,612 | |
Workforce Employed | 2,376 | 14,737 | 46,073 | |
Workforce Unemployed | 91 | 452 | 2,224 | |
Civlian Workforce | 2,467 | 15,189 | 48,298 | |
Military Workforce | 2 | 21 | 27 | |
Total Households | 1,804 | 10,682 | 37,941 | |
Family Households | 1,223 | 8,033 | 24,376 | |
Non-Family Households | 582 | 2,648 | 13,565 | |
Married Couple | 989 | 6,969 | 18,361 | |
Other Family | 234 | 1,064 | 6,015 | |
Married w/Child | 465 | 3,131 | 7,349 | |
Single Male w/Child | 2 | 133 | 852 | |
Single Female w/Child | 134 | 363 | 2,340 |
Population Change Last Two Decades - Plus Projection
2000 | % | 2010 | % | 2020 | % | 2030 | |
---|---|---|---|---|---|---|---|
Ohio | 11,353,140 | +2 | 11,536,504 | 0 | 11,574,870 | 0 | 11,615,100 |
Geauga County | 90,895 | +3 | 93,389 | 0 | 93,510 | +2 | 94,930 |
Summit County | 542,899 | 0 | 541,781 | -1 | 534,150 | -1 | 528,990 |
Portage County | 152,061 | +6 | 161,419 | 0 | 161,410 | -2 | 158,930 |
Cuyahoga County | 1,393,978 | -8 | 1,280,122 | -6 | 1,209,550 | -5 | 1,154,210 |
Total Working Age Population:
Total Households:
Total Working Age Population:
Total Households:
Total Working Age Population:
Total Households: