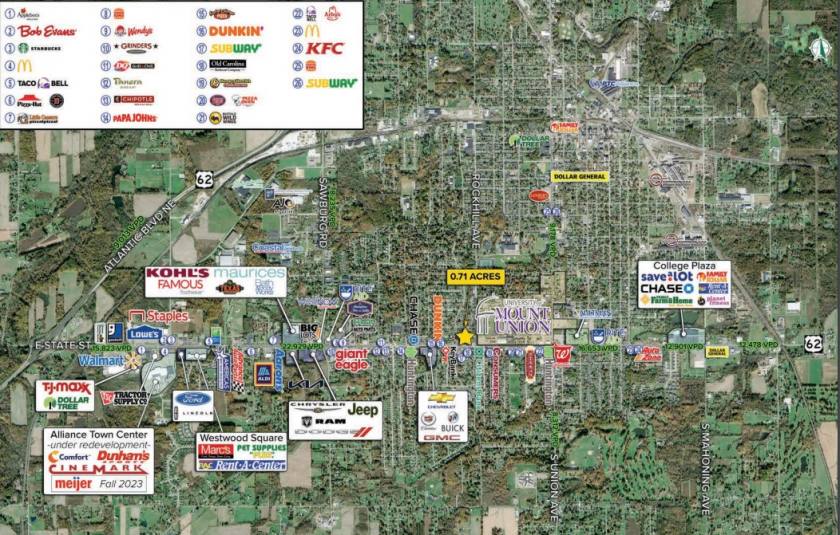
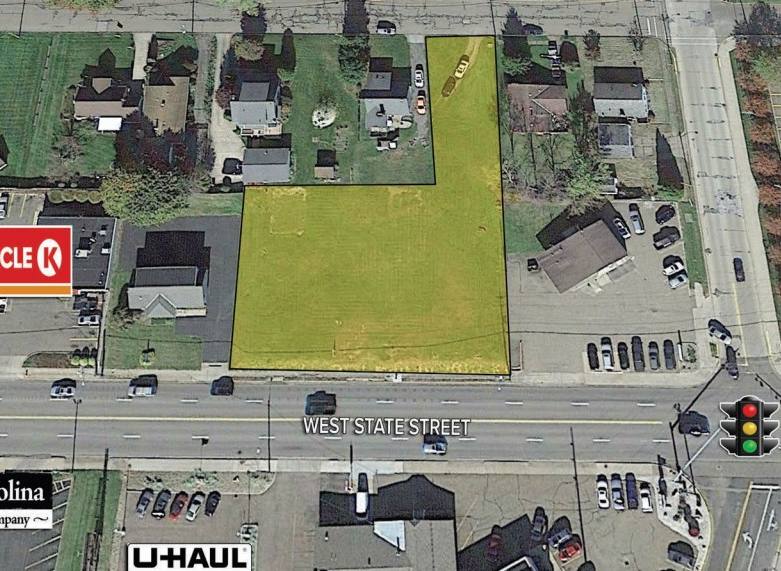
1-Mile | 3-Miles | 5-Miles | ||
---|---|---|---|---|
Total Population | 8,700 | 26,899 | 35,123 | |
Population Median Age | 39 | 40 | 42 | |
Population by Age | 0-9 Yrs | 769 (8%) | 3048 (11%) | 3619 (10%) |
10-19 Yrs | 1701 (19%) | 3833 (14%) | 4523 (12%) | |
20-29 Yrs | 1556 (17%) | 4068 (15%) | 4850 (13%) | |
30-39 Yrs | 562 (6%) | 2493 (9%) | 3187 (9%) | |
40-49 Yrs | 880 (10%) | 2879 (10%) | 3611 (10%) | |
50-59 Yrs | 1062 (12%) | 3745 (13%) | 5221 (14%) | |
60-69 Yrs | 1080 (12%) | 3455 (12%) | 4859 (13%) | |
70+ Yrs | 1088 (12%) | 3377 (12%) | 5252 (14%) | |
Median HH Income | $52,605 | $43,286 | $45,861 | |
Total Household Income | < 24K | 759 (23%) | 3397 (31%) | 4190 (28%) |
25-49K | 748 (23%) | 2675 (24%) | 3643 (24%) | |
50-74K | 793 (24%) | 2451 (22%) | 3189 (21%) | |
75-99K | 399 (12%) | 1266 (11%) | 1771 (12%) | |
100-199K | 488 (15%) | 1055 (9%) | 1742 (11%) | |
200K+ | 14 (0%) | 111 (1%) | 190 (1%) | |
Highest Education Level | No Diploma | 442 | 2118 | 2708 |
Diploma or GED | 2175 | 8210 | 11237 | |
Some College | 931 | 3266 | 4645 | |
Assoc. Degree | 208 | 936 | 1369 | |
Bachelors Degree | 817 | 2001 | 2742 | |
Higher Degree | 541 | 1149 | 1506 | |
Total Housing Units | 3,393 | 12,085 | 16,193 | |
--Owner-Occupied | 1,862 | 5,877 | 8,451 | |
--Renter-Occupied | 1,341 | 5,078 | 6,274 | |
Owner-Occupied Values | < 100K | 859 | 2961 | 3728 |
100-199K | 838 | 2140 | 3407 | |
200-299K | 103 | 498 | 825 | |
300-399K | 27 | 94 | 226 | |
400-499K | 0 | 16 | 50 | |
500K+ | 36 | 167 | 215 | |
Total Working Age Population | 7,328 | 21,964 | 29,212 | |
In Work Force | 4,076 | 12,498 | 16,540 | |
Not In Work Force | 3,252 | 9,466 | 12,673 | |
Workforce Employed | 3,904 | 11,553 | 15,400 | |
Workforce Unemployed | 172 | 945 | 1,140 | |
Civlian Workforce | 4,076 | 12,498 | 16,540 | |
Military Workforce | 0 | 0 | 0 | |
Total Households | 3,203 | 10,955 | 14,725 | |
Family Households | 1,808 | 6,429 | 8,835 | |
Non-Family Households | 1,396 | 4,526 | 5,891 | |
Married Couple | 1,329 | 4,128 | 6,102 | |
Other Family | 479 | 2,301 | 2,733 | |
Married w/Child | 468 | 1,364 | 1,773 | |
Single Male w/Child | 58 | 187 | 247 | |
Single Female w/Child | 129 | 941 | 1,117 |
Population Change Last Two Decades - Plus Projection
2000 | % | 2010 | % | 2020 | % | 2030 | |
---|---|---|---|---|---|---|---|
Ohio | 11,353,140 | +2 | 11,536,504 | 0 | 11,574,870 | 0 | 11,615,100 |
Stark County | 378,098 | -1 | 375,586 | -2 | 368,210 | -2 | 361,130 |
Mahoning County | 257,555 | -7 | 238,823 | -6 | 224,680 | -6 | 212,240 |
Columbiana County | 112,075 | -4 | 107,841 | -2 | 105,380 | -1 | 103,870 |
Total Working Age Population:
Total Households:
Total Working Age Population:
Total Households:
Total Working Age Population:
Total Households: