Multifamily Housing
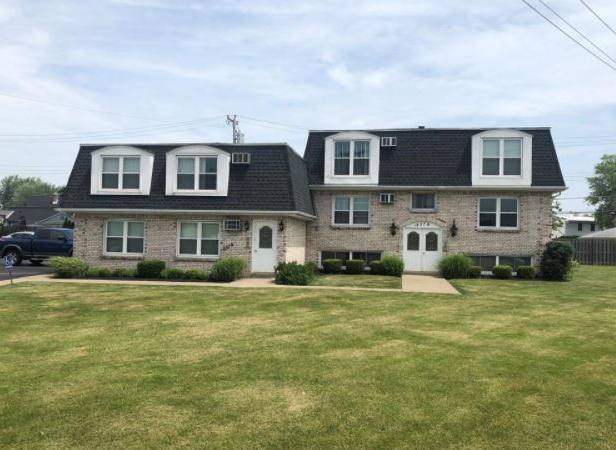
2379 Eggert Road Tonawanda, NY 14150
2379 Eggert Road Tonawanda, NY 14150
Details & Description
Property Highlights
- • Excellent Investment Opportunity
- • 7 Unit Multi-Family
- • Meticulously maintained
- • New Boiler System 2022
- • 7,136+/- SF Building
- • Fully Occupied
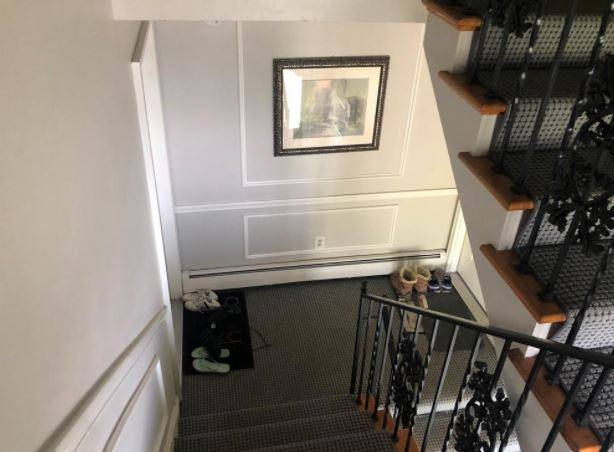
Additional Photos


Listing Agents

Rick Recckio
O: 716-631-5555
M: 716-998-4422
rick@recckio.com
O: 716-631-5555
M: 716-998-4422
rick@recckio.com
While we strive to provide the most accurate information, all listing information, and demographic data, is provided by third-parties. As such, MyEListing will not be responsible for the accuracy of the information. It is strongly recommended that you verify all information with the listing agent, and any relevant agencies, prior to making any decisions.