Industrial Properties
215 East 1st Avenue Roselle, NJ 07203
215 East 1st Avenue Roselle, NJ 07203

Details & Description
Property Highlights
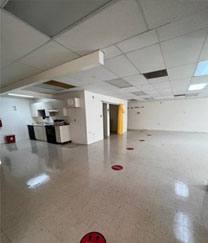
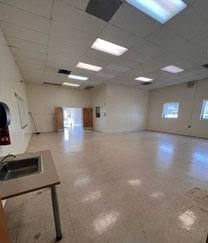
• Flex Space / Specialty / Warehouse
• Flex Space / Specialty / Warehouse
Additional Photos


Listing Agents

Dylan Meade
O: 973-379-6644
dmeade@blauberg.com
O: 973-379-6644
dmeade@blauberg.com
While we strive to provide the most accurate information, all listing information, and demographic data, is provided by third-parties. As such, MyEListing will not be responsible for the accuracy of the information. It is strongly recommended that you verify all information with the listing agent, and any relevant agencies, prior to making any decisions.


