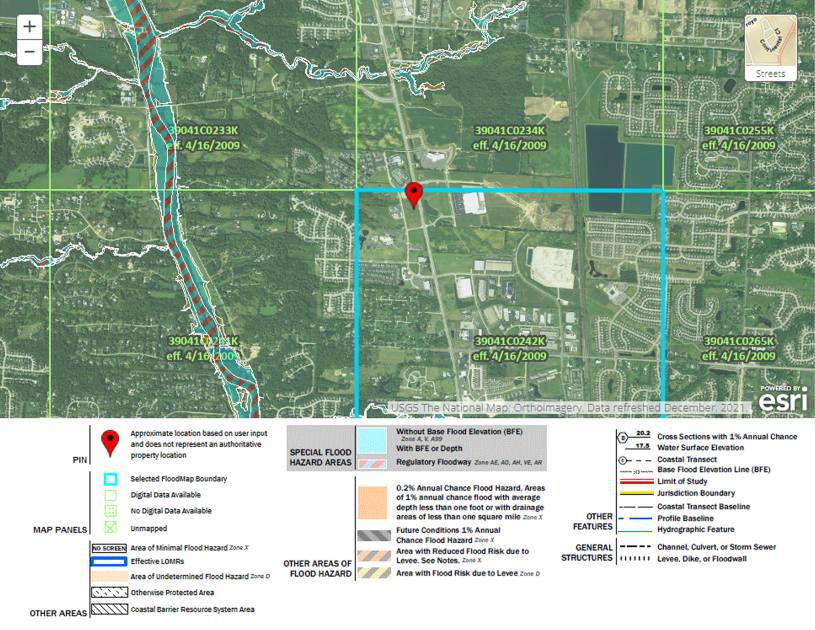
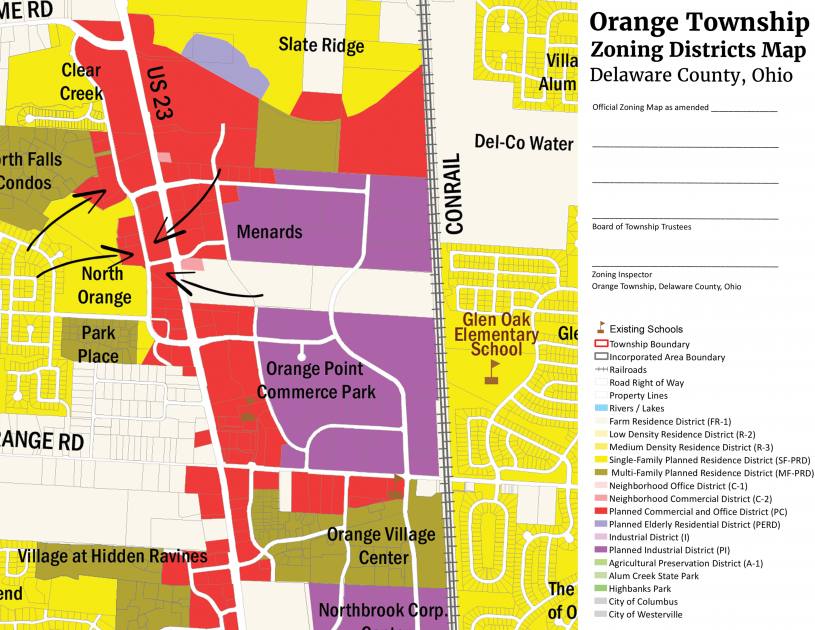
1-Mile | 3-Miles | 5-Miles | ||
---|---|---|---|---|
Total Population | 1,945 | 34,519 | 113,889 | |
Population Median Age | 44 | 35 | 35 | |
Population by Age | 0-9 Yrs | 193 (9%) | 5382 (15%) | 18034 (15%) |
10-19 Yrs | 278 (14%) | 5720 (16%) | 16506 (14%) | |
20-29 Yrs | 128 (6%) | 2708 (7%) | 12240 (10%) | |
30-39 Yrs | 245 (12%) | 4967 (14%) | 17479 (15%) | |
40-49 Yrs | 212 (10%) | 6549 (18%) | 18438 (16%) | |
50-59 Yrs | 259 (13%) | 4429 (12%) | 13971 (12%) | |
60-69 Yrs | 232 (11%) | 2562 (7%) | 9089 (7%) | |
70+ Yrs | 397 (20%) | 2202 (6%) | 8131 (7%) | |
Median HH Income | $106,546 | $144,782 | $119,242 | |
Total Household Income | < 24K | 21 (2%) | 326 (2%) | 2022 (5%) |
25-49K | 171 (22%) | 1070 (9%) | 4359 (10%) | |
50-74K | 70 (9%) | 1018 (9%) | 5208 (12%) | |
75-99K | 88 (11%) | 839 (7%) | 4916 (12%) | |
100-199K | 213 (28%) | 4486 (40%) | 14899 (37%) | |
200K+ | 181 (24%) | 3443 (30%) | 8759 (21%) | |
Highest Education Level | No Diploma | 59 | 438 | 1472 |
Diploma or GED | 243 | 1850 | 8635 | |
Some College | 276 | 3315 | 11663 | |
Assoc. Degree | 101 | 1377 | 4828 | |
Bachelors Degree | 399 | 8249 | 27529 | |
Higher Degree | 325 | 6730 | 20084 | |
Total Housing Units | 761 | 11,690 | 42,187 | |
--Owner-Occupied | 631 | 9,565 | 29,500 | |
--Renter-Occupied | 113 | 1,618 | 10,663 | |
Owner-Occupied Values | < 100K | 16 | 147 | 774 |
100-199K | 65 | 553 | 3901 | |
200-299K | 153 | 2136 | 7504 | |
300-399K | 97 | 3546 | 8411 | |
400-499K | 187 | 1735 | 4893 | |
500K+ | 112 | 1448 | 4018 | |
Total Working Age Population | 1,567 | 25,268 | 84,851 | |
In Work Force | 849 | 18,418 | 62,943 | |
Not In Work Force | 718 | 6,850 | 21,908 | |
Workforce Employed | 806 | 18,030 | 61,559 | |
Workforce Unemployed | 43 | 388 | 1,337 | |
Civlian Workforce | 849 | 18,418 | 62,896 | |
Military Workforce | 0 | 0 | 47 | |
Total Households | 744 | 11,182 | 40,163 | |
Family Households | 519 | 9,450 | 29,542 | |
Non-Family Households | 225 | 1,732 | 10,621 | |
Married Couple | 495 | 8,418 | 25,501 | |
Other Family | 24 | 1,033 | 4,041 | |
Married w/Child | 199 | 5,103 | 14,592 | |
Single Male w/Child | 4 | 209 | 793 | |
Single Female w/Child | 13 | 575 | 1,847 |
Population Change Last Two Decades - Plus Projection
2000 | % | 2010 | % | 2020 | % | 2030 | |
---|---|---|---|---|---|---|---|
Ohio | 11,353,140 | +2 | 11,536,504 | 0 | 11,574,870 | 0 | 11,615,100 |
Delaware County | 109,989 | +58 | 174,214 | +21 | 210,630 | +17 | 246,000 |
Franklin County | 1,068,978 | +9 | 1,163,414 | +11 | 1,291,320 | +8 | 1,394,980 |
Total Working Age Population:
Total Households:
Total Working Age Population:
Total Households:
Total Working Age Population:
Total Households: