Commercial Land
14907 Cainsville Road Lebanon, TN 37090
14907 Cainsville Road Lebanon, TN 37090

Details & Description
Property Highlights
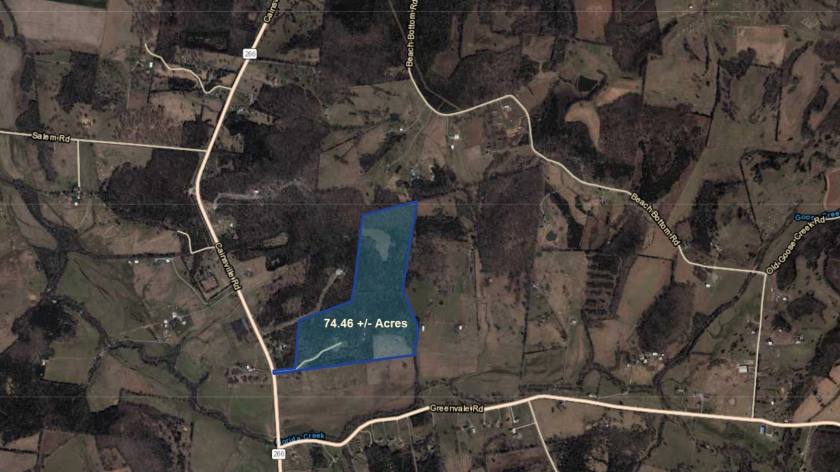
- • 50 ft frontage on Cainsville Road
- • Good opportunity for a farm or future development
- • Current zoning: Agricultural
- • Midway between Lebanon and Murfreesboro
Listing Agents

Rita Anderson
O: 615-754-2442
rita.acb@outlook.com
O: 615-754-2442
rita.acb@outlook.com
While we strive to provide the most accurate information, all listing information, and demographic data, is provided by third-parties. As such, MyEListing will not be responsible for the accuracy of the information. It is strongly recommended that you verify all information with the listing agent, and any relevant agencies, prior to making any decisions.