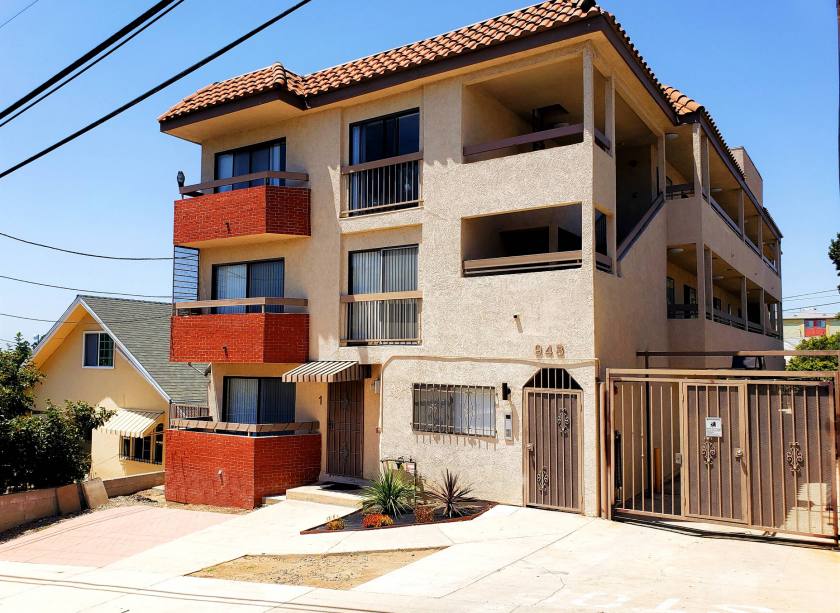
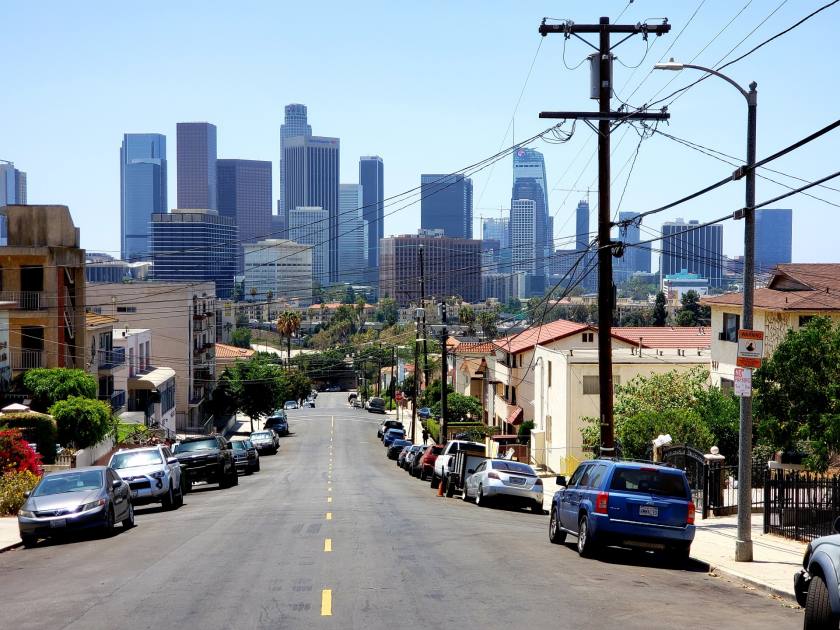
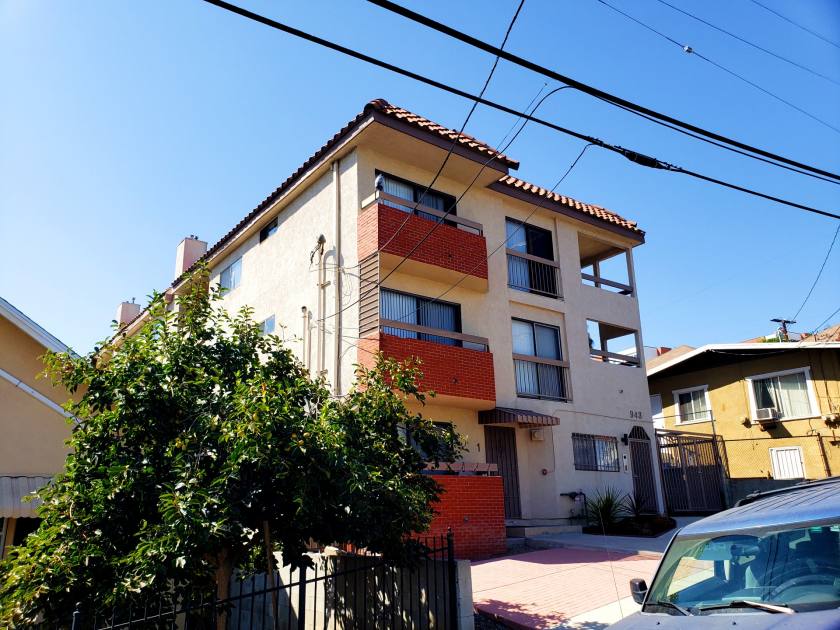
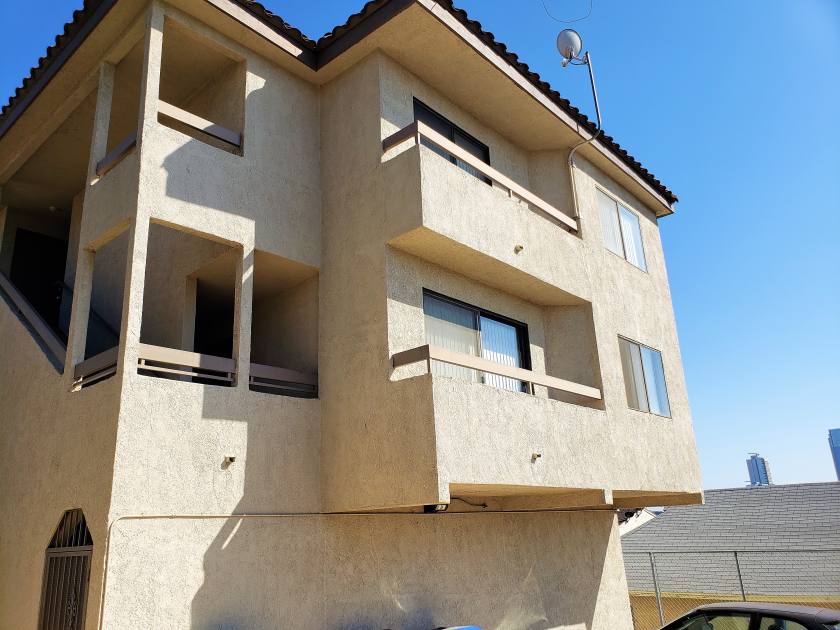
Tolj Commercial Real Estate is pleased to offer an eight-unit multifamily apartment building located at 943 Centennial Street in Los Angeles. The subject property is conveniently located near major retailers, bars, shopping centers, and restaurants, and within driving distance to major entertainment and sporting venues Walt Disney Music Hall, Civil Center, Crypto Arena (formerly Staple Center), Dodger Station and moreThe subject property consists of 6,570-sf building situated on 6 983 sf lot zoned Los Angeles Multiple Residential (LAR-3-1). There are ten (10) onsite parking stalls with street and alley access either from Figueroa Terrace or West College Street. Unit-mix is comprised of (6) two bedroom and one-bathroom units, (1) one bedroom and one-bathroom unit, and (1) three bedroom and two-bathroom unit, a total of seventeen (17) bedrooms and ten (10) bathrooms. One main laundry room onsite. Each unit is individually metered for electricity and gas. There is one master water meter for the entire property. Minutes from the 110, 210 and 134 freeways and accessible to Downtown Los Angeles, a vibrant city center.Disclaimer: All information provided herein together with any projections or other data has been furnished from sources which we deem reliable, but for which we assume no liability, expressed or implied. Interested parties are to conduct independent investigation and verification of all information including but not limited to condition of the property, compliance or lack of compliance with applicable governmental requirements, development potential or suitability, financial performance of the property, projected financial performance of the property, any party’s intended use or any and all other matters.