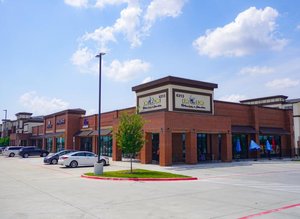
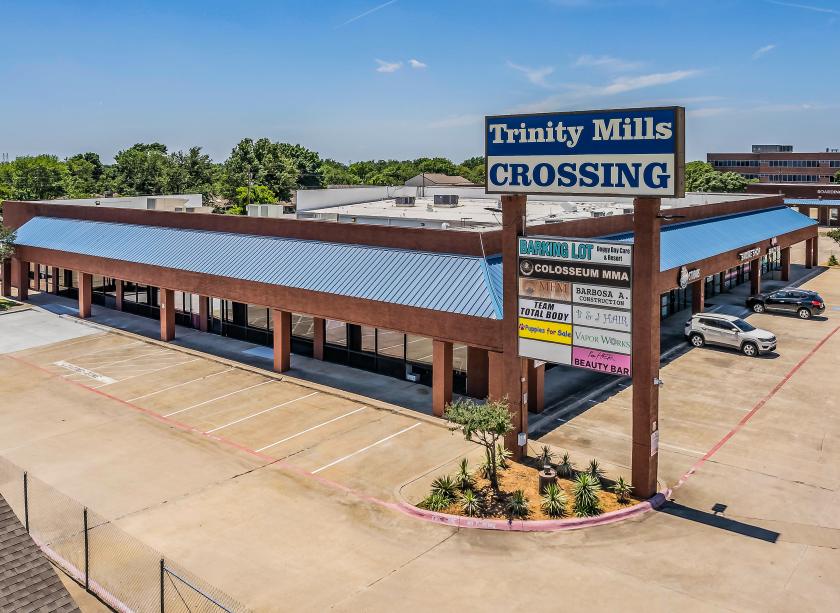
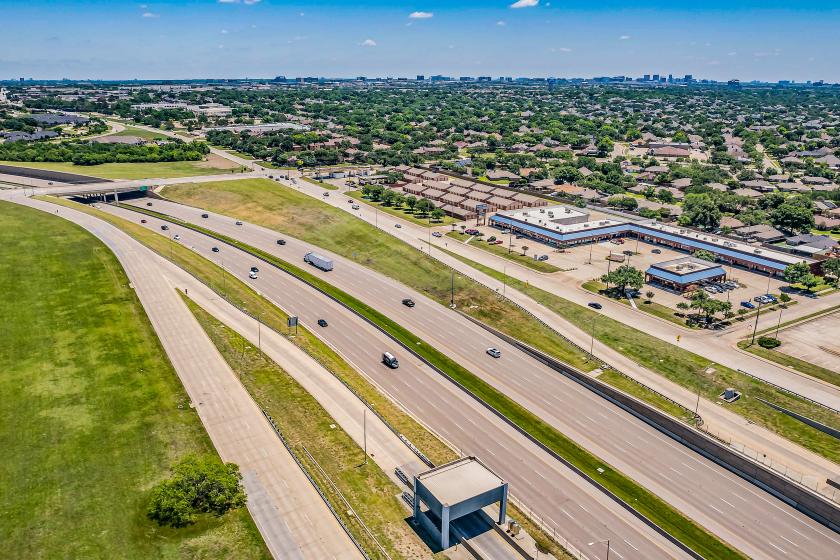
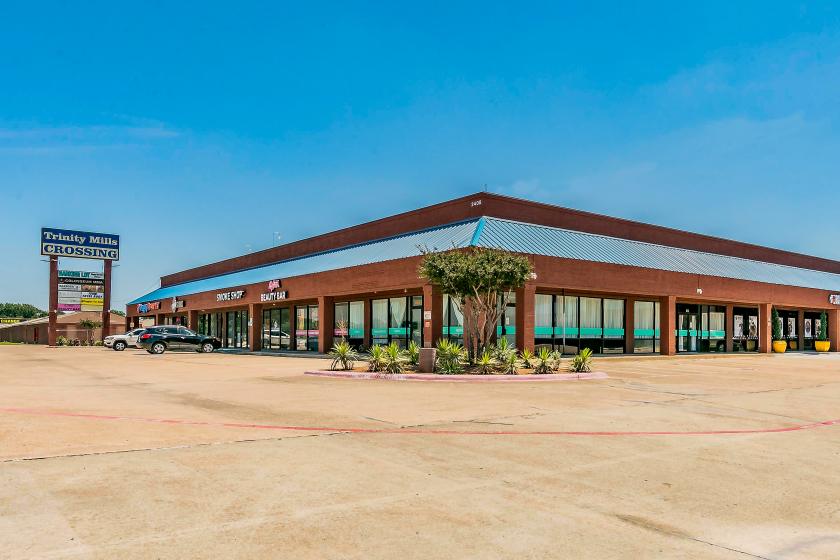
1-Mile | 3-Miles | 5-Miles | ||
---|---|---|---|---|
Total Population | 20,851 | 153,692 | 346,072 | |
Population Median Age | 39 | 38 | 38 | |
Population by Age | 0-9 Yrs | 2401 (11%) | 16886 (10%) | 38951 (11%) |
10-19 Yrs | 2118 (10%) | 17009 (11%) | 37588 (10%) | |
20-29 Yrs | 3309 (15%) | 24745 (16%) | 56411 (16%) | |
30-39 Yrs | 3124 (14%) | 27841 (18%) | 60819 (17%) | |
40-49 Yrs | 2695 (12%) | 21763 (14%) | 47237 (13%) | |
50-59 Yrs | 2856 (13%) | 18366 (11%) | 45016 (13%) | |
60-69 Yrs | 2455 (11%) | 15153 (9%) | 33169 (9%) | |
70+ Yrs | 1894 (9%) | 11929 (7%) | 26881 (7%) | |
Median HH Income | $75,545 | $67,634 | $73,353 | |
Total Household Income | < 24K | 1032 (12%) | 7220 (11%) | 15472 (10%) |
25-49K | 1765 (21%) | 15337 (24%) | 30748 (21%) | |
50-74K | 1223 (15%) | 12808 (20%) | 28404 (19%) | |
75-99K | 1356 (16%) | 8627 (13%) | 20423 (14%) | |
100-199K | 2198 (27%) | 14881 (23%) | 34945 (23%) | |
200K+ | 525 (6%) | 4770 (7%) | 15711 (10%) | |
Highest Education Level | No Diploma | 1930 | 12378 | 23298 |
Diploma or GED | 3574 | 22504 | 41840 | |
Some College | 3390 | 24086 | 49083 | |
Assoc. Degree | 1038 | 7577 | 15914 | |
Bachelors Degree | 3312 | 30639 | 77775 | |
Higher Degree | 1569 | 13273 | 39960 | |
Total Housing Units | 8,418 | 68,245 | 159,179 | |
--Owner-Occupied | 4,640 | 28,812 | 64,261 | |
--Renter-Occupied | 3,460 | 34,831 | 81,441 | |
Owner-Occupied Values | < 100K | 149 | 765 | 1879 |
100-199K | 1454 | 7680 | 12968 | |
200-299K | 2009 | 10283 | 16728 | |
300-399K | 938 | 6653 | 13393 | |
400-499K | 55 | 1886 | 7771 | |
500K+ | 35 | 1545 | 11522 | |
Total Working Age Population | 17,161 | 126,043 | 284,261 | |
In Work Force | 12,781 | 94,877 | 214,241 | |
Not In Work Force | 4,380 | 31,166 | 70,020 | |
Workforce Employed | 12,209 | 91,210 | 205,955 | |
Workforce Unemployed | 544 | 3,558 | 8,086 | |
Civlian Workforce | 12,753 | 94,768 | 214,041 | |
Military Workforce | 28 | 109 | 200 | |
Total Households | 8,100 | 63,643 | 145,702 | |
Family Households | 4,983 | 36,873 | 82,964 | |
Non-Family Households | 3,117 | 26,770 | 62,738 | |
Married Couple | 3,782 | 26,574 | 61,897 | |
Other Family | 1,201 | 10,299 | 21,068 | |
Married w/Child | 1,659 | 10,831 | 25,284 | |
Single Male w/Child | 93 | 994 | 2,311 | |
Single Female w/Child | 372 | 4,462 | 8,867 |
Population Change Last Two Decades - Plus Projection
2000 | % | 2010 | % | 2020 | % | 2030 | |
---|---|---|---|---|---|---|---|
Texas | 20,851,820 | +21 | 25,145,561 | +18 | 29,677,668 | +18 | 34,894,452 |
Denton County | 432,976 | +53 | 662,614 | +36 | 897,953 | +37 | 1,234,110 |
Collin County | 491,675 | +59 | 782,341 | +33 | 1,039,369 | +34 | 1,391,461 |
Dallas County | 2,218,899 | +7 | 2,368,139 | +15 | 2,734,111 | +14 | 3,106,298 |
Total Working Age Population:
Total Households:
Total Working Age Population:
Total Households:
Total Working Age Population:
Total Households: