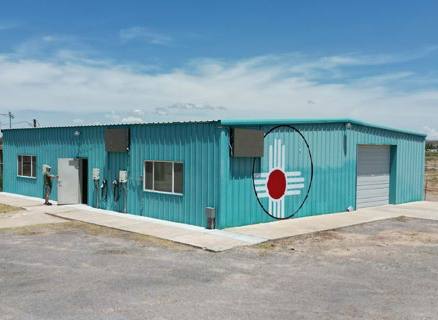
Flex-Office-Warehouse
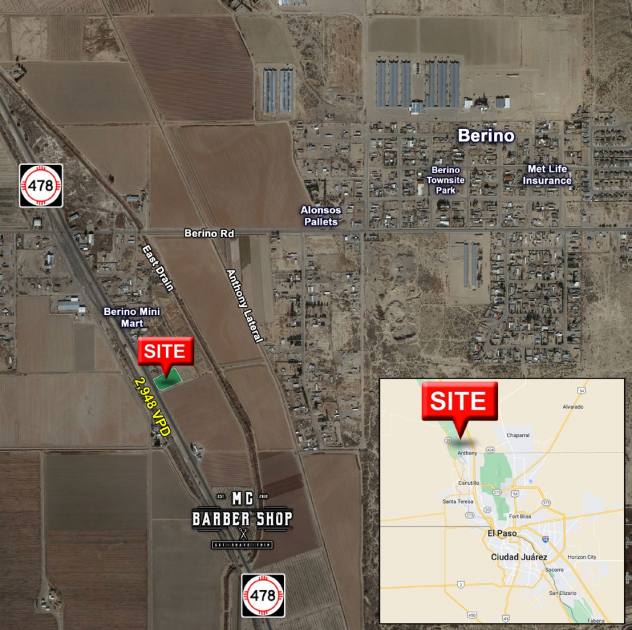
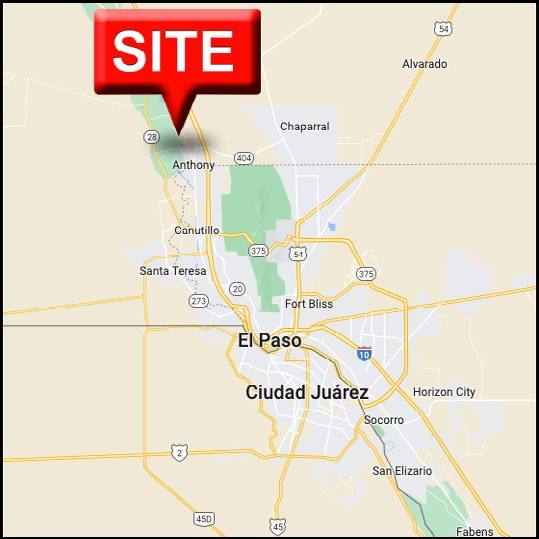
4408 New Mexico 478 Anthony, NM 88021
4408 New Mexico 478 Anthony, NM 88021
Details & Description
Property Highlights
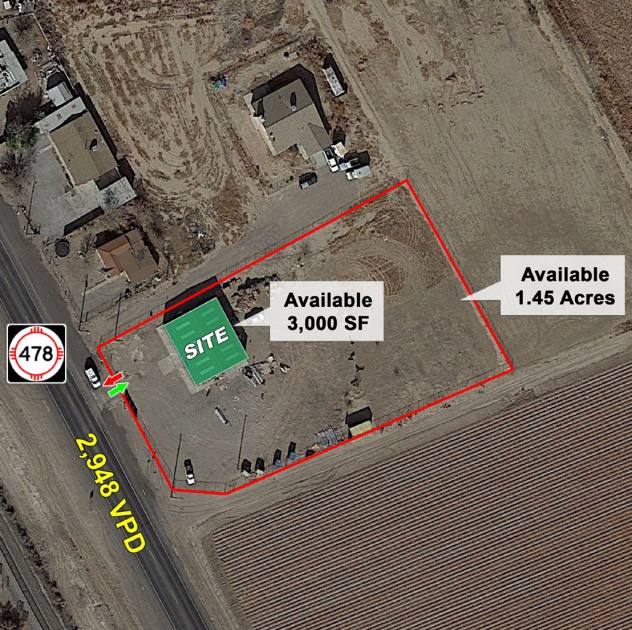
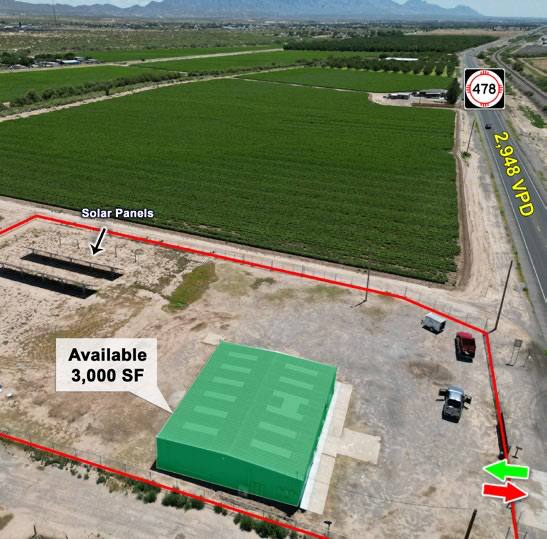
- • 3,000 SF
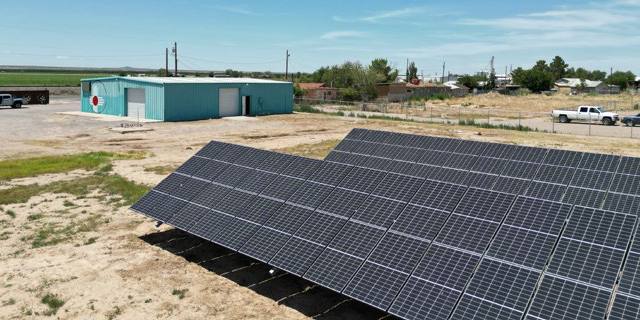
- • 32.12 KW Solar System
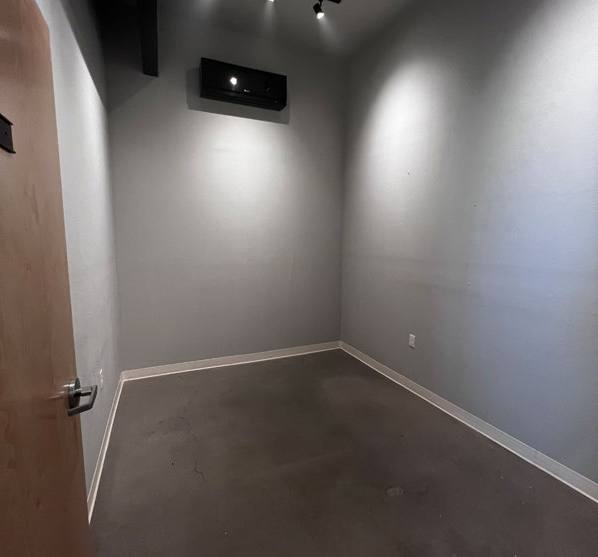
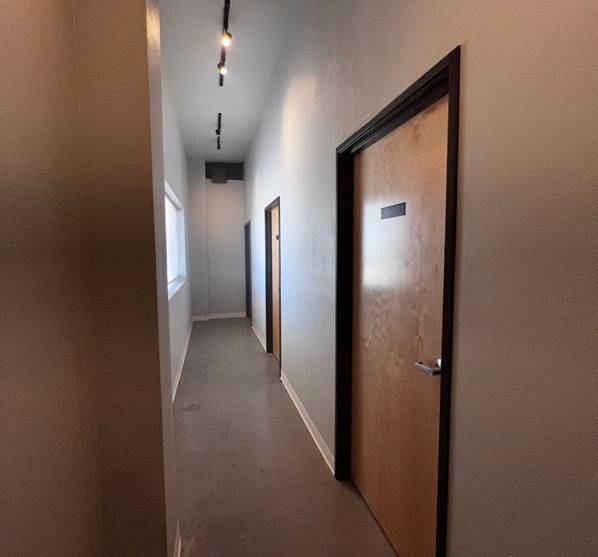
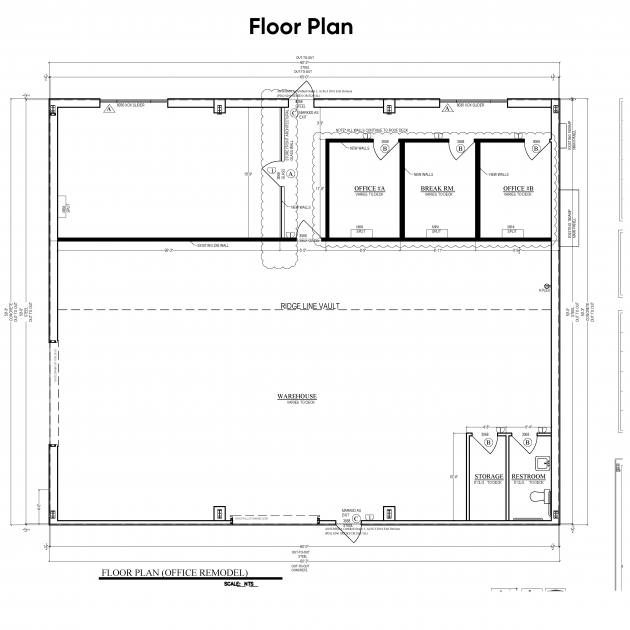
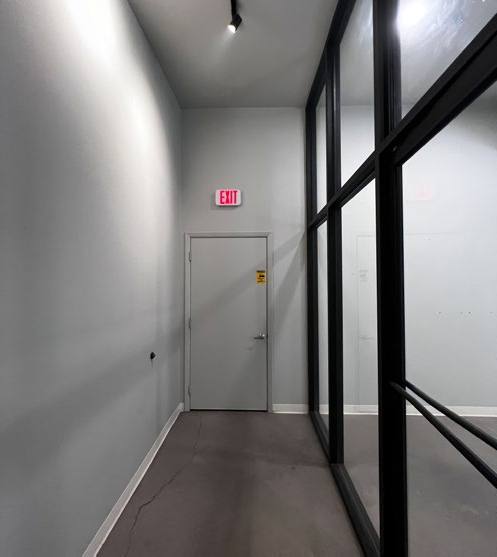
- • Property redeveloped with new office buildout
- • 3 Private offices & Conference Room
- • 2 Electric overhead doors to warehouse
- • 1.45 Acres
Additional Photos
Listing Agents

Daniel Kearney
O: 505-720-7089
dkearney@resolutre.com
O: 505-720-7089
dkearney@resolutre.com

Rob Powell
O: 505-715-9561
rpowell@resolutre.com
O: 505-715-9561
rpowell@resolutre.com

Austin Tidwell
O: 505-702-1379
atidwell@resolutre.com
O: 505-702-1379
atidwell@resolutre.com
While we strive to provide the most accurate information, all listing information, and demographic data, is provided by third-parties. As such, MyEListing will not be responsible for the accuracy of the information. It is strongly recommended that you verify all information with the listing agent, and any relevant agencies, prior to making any decisions.