Commercial Land
700 Interstate 30 Rockwall, TX 75087
700 Interstate 30 Rockwall, TX 75087
Details & Description
Property Highlights
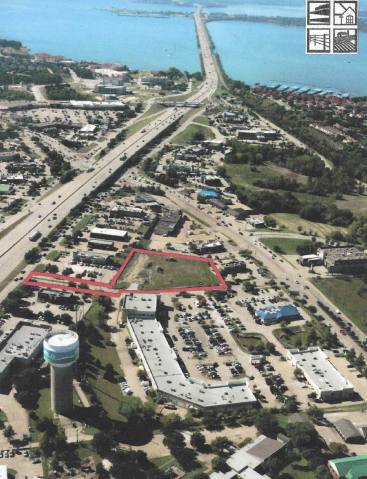
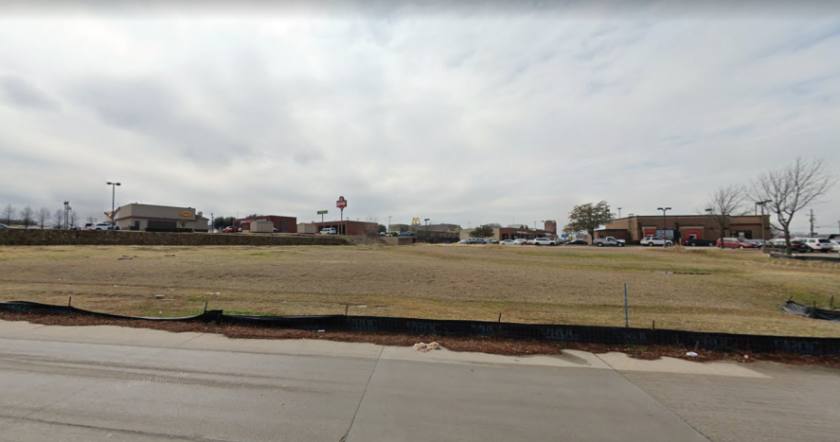
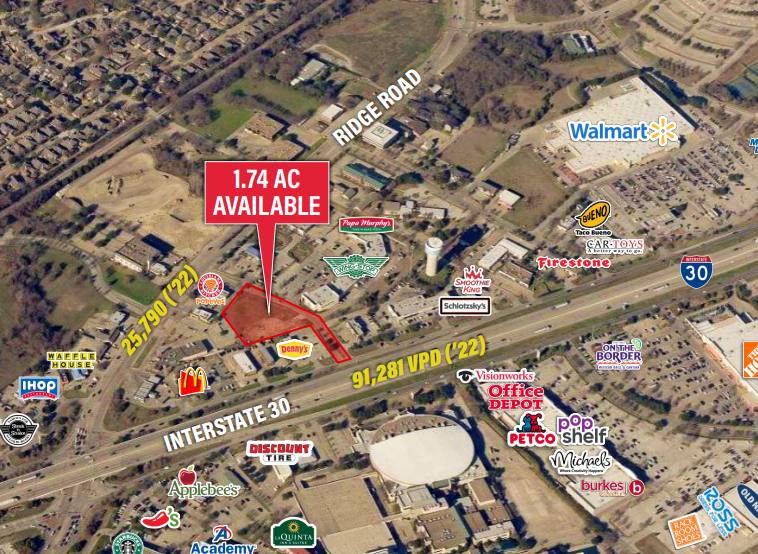
- • Prime Rockwall real estate with visibility
- • High traffic counts
- • Legacy commercial infill opportunity
- • Close proximity to many national generators
- • Option for ground lease or BTS
Listing Agents

Brian Hanie
O: 214-466-1541
brian@structurecommercial.com
O: 214-466-1541
brian@structurecommercial.com

Jake Burns
O: 214-466-1549
M: 405-830-5304
jake@structurecommercial.com
O: 214-466-1549
M: 405-830-5304
jake@structurecommercial.com
While we strive to provide the most accurate information, all listing information, and demographic data, is provided by third-parties. As such, MyEListing will not be responsible for the accuracy of the information. It is strongly recommended that you verify all information with the listing agent, and any relevant agencies, prior to making any decisions.