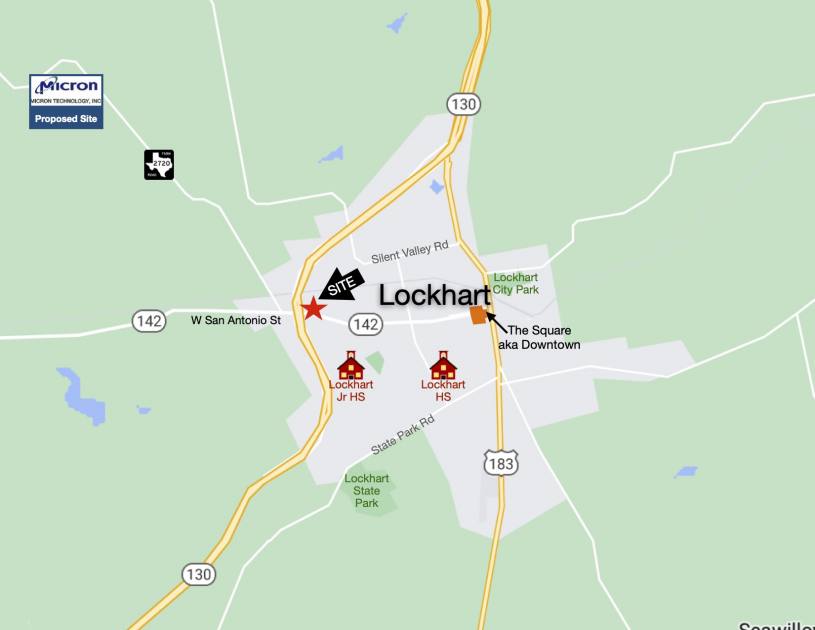
1-Mile | 3-Miles | 5-Miles | ||
---|---|---|---|---|
Total Population | 2,381 | 10,861 | 15,925 | |
Population Median Age | 39 | 39 | 39 | |
Population by Age | 0-9 Yrs | 266 (11%) | 1290 (11%) | 1799 (11%) |
10-19 Yrs | 328 (13%) | 1513 (13%) | 2023 (12%) | |
20-29 Yrs | 311 (13%) | 1404 (12%) | 2156 (13%) | |
30-39 Yrs | 295 (12%) | 1340 (12%) | 2178 (13%) | |
40-49 Yrs | 363 (15%) | 1467 (13%) | 2162 (13%) | |
50-59 Yrs | 258 (10%) | 1374 (12%) | 2002 (12%) | |
60-69 Yrs | 356 (14%) | 1384 (12%) | 1964 (12%) | |
70+ Yrs | 203 (8%) | 1089 (10%) | 1641 (10%) | |
Median HH Income | $58,902 | $60,604 | $60,795 | |
Total Household Income | < 24K | 146 (15%) | 674 (17%) | 994 (18%) |
25-49K | 255 (27%) | 911 (23%) | 1224 (23%) | |
50-74K | 208 (22%) | 871 (22%) | 1138 (21%) | |
75-99K | 151 (16%) | 548 (14%) | 779 (14%) | |
100-199K | 160 (17%) | 741 (19%) | 971 (18%) | |
200K+ | 5 (0%) | 136 (3%) | 181 (3%) | |
Highest Education Level | No Diploma | 118 | 1156 | 2000 |
Diploma or GED | 716 | 2993 | 4578 | |
Some College | 380 | 1673 | 2489 | |
Assoc. Degree | 32 | 256 | 412 | |
Bachelors Degree | 285 | 972 | 1226 | |
Higher Degree | 125 | 410 | 537 | |
Total Housing Units | 980 | 4,307 | 5,835 | |
--Owner-Occupied | 608 | 2,459 | 3,383 | |
--Renter-Occupied | 317 | 1,424 | 1,904 | |
Owner-Occupied Values | < 100K | 103 | 629 | 910 |
100-199K | 233 | 970 | 1366 | |
200-299K | 257 | 656 | 830 | |
300-399K | 15 | 169 | 196 | |
400-499K | 0 | 21 | 55 | |
500K+ | 0 | 14 | 26 | |
Total Working Age Population | 1,882 | 8,551 | 12,839 | |
In Work Force | 1,232 | 5,452 | 7,220 | |
Not In Work Force | 650 | 3,098 | 5,618 | |
Workforce Employed | 1,212 | 5,359 | 7,088 | |
Workforce Unemployed | 20 | 93 | 132 | |
Civlian Workforce | 1,232 | 5,452 | 7,220 | |
Military Workforce | 0 | 0 | 0 | |
Total Households | 925 | 3,882 | 5,287 | |
Family Households | 608 | 2,550 | 3,480 | |
Non-Family Households | 317 | 1,332 | 1,807 | |
Married Couple | 481 | 1,922 | 2,645 | |
Other Family | 127 | 628 | 835 | |
Married w/Child | 214 | 721 | 984 | |
Single Male w/Child | 4 | 51 | 94 | |
Single Female w/Child | 94 | 286 | 346 |
Population Change Last Two Decades - Plus Projection
2000 | % | 2010 | % | 2020 | % | 2030 | |
---|---|---|---|---|---|---|---|
Texas | 20,851,820 | +21 | 25,145,561 | +18 | 29,677,668 | +18 | 34,894,452 |
Caldwell County | 32,194 | +18 | 38,066 | +16 | 44,284 | +15 | 50,777 |
Total Working Age Population:
Total Households:
Total Working Age Population:
Total Households:
Total Working Age Population:
Total Households: