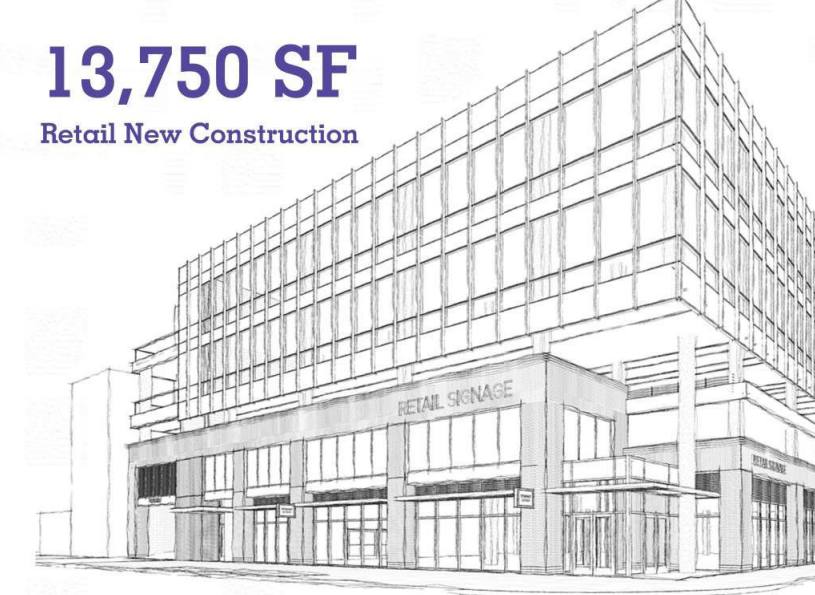
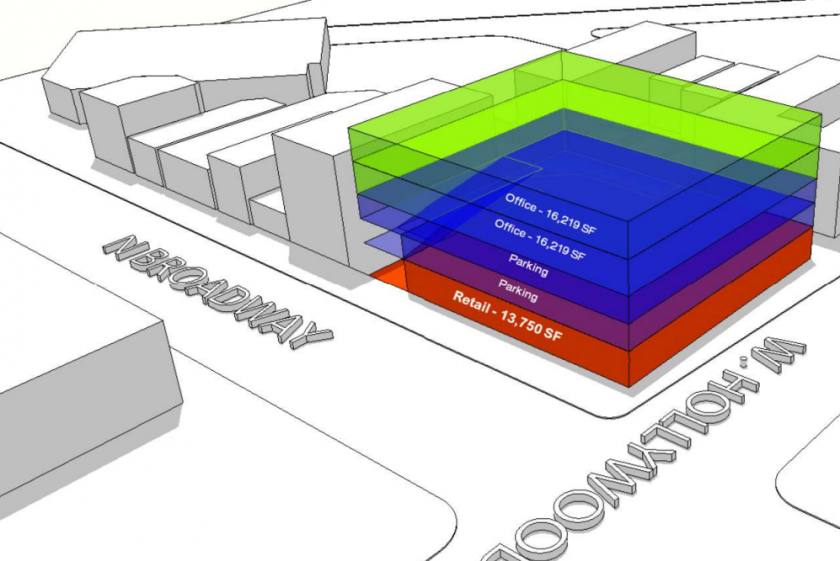
Retail Space
5650 North Broadway Chicago, IL 60660
5650 North Broadway Chicago, IL 60660
Details & Description
Property Highlights
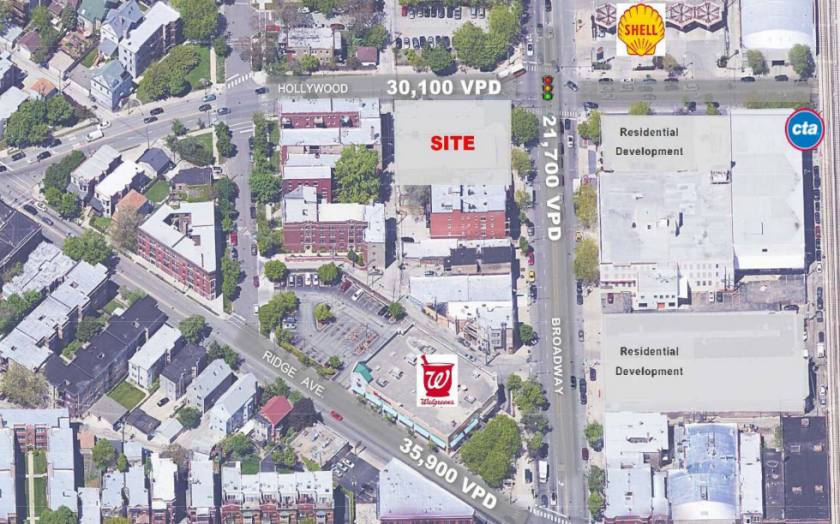
- • 51,800 VPD Hard Corner
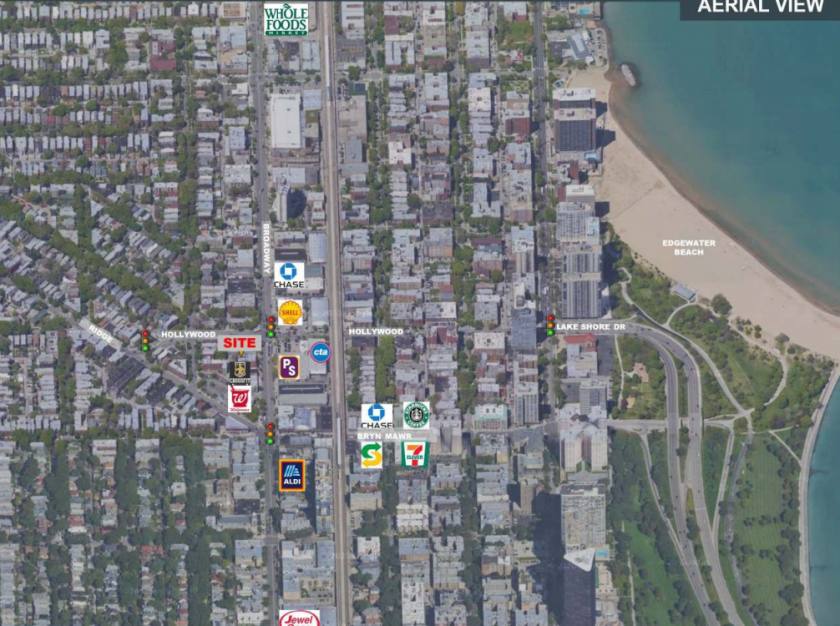
- • 87,700 VPD one-block radius
- • Primary commuter route
- • 81 Parking Stalls
- • Build to suit opportunity
- • Residential development planned opposite
Additional Photos
Listing Agents

Chad Bermingham
O: 312-796-0361
M: 312-259-7990
chad.bermingham@avisonyoung.com
O: 312-796-0361
M: 312-259-7990
chad.bermingham@avisonyoung.com
While we strive to provide the most accurate information, all listing information, and demographic data, is provided by third-parties. As such, MyEListing will not be responsible for the accuracy of the information. It is strongly recommended that you verify all information with the listing agent, and any relevant agencies, prior to making any decisions.


